
Figures & data
Table 1. Previous research on masonry wall testing and modeling.
Figure 1. Feature selection using mutual information and F-test statistics.
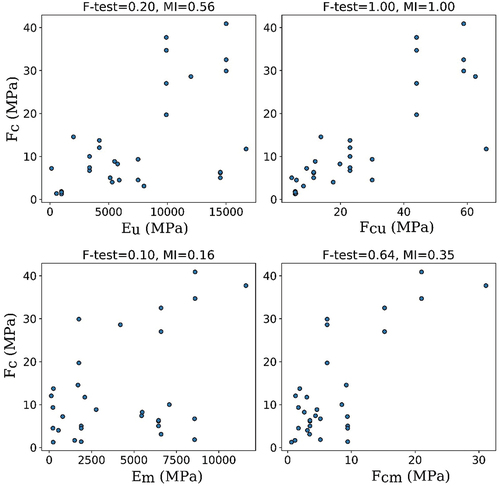
Table 2. Descriptive statistics of masonry wall dataset.
Table 3. Input output (I/O) combinations arrived based on mutual information criteria.
Figure 2. Methodology flowchart.
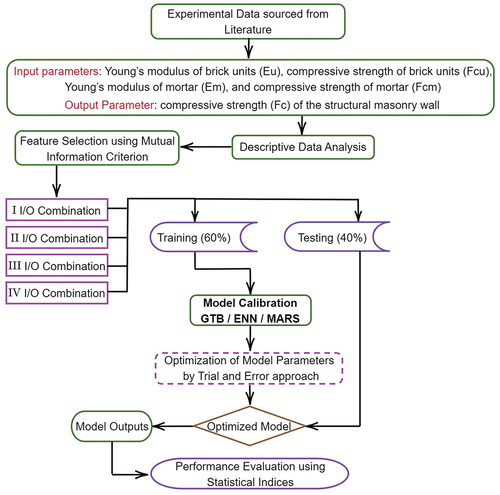
Table 4. Model parameters optimized by trial-and-error approach.
Figure 3. Violin and swarm plots for comparative performance evaluation of models.
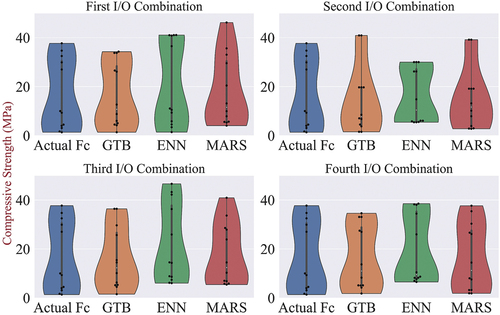
Figure 4. Scatter plots of actual v/s predicted compressive strength (test phase data).
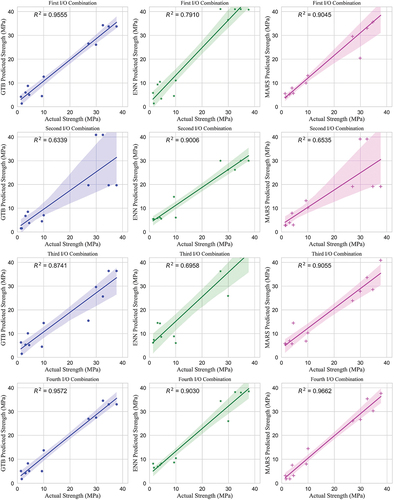
Figure 5. Taylor diagrams to graphically indicate the performance of each model in terms of RMSD, correlation coefficient and Standard deviation statistics (test phase data).
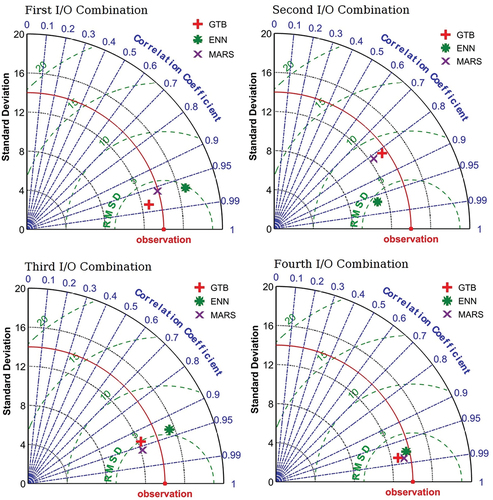
Table 5. Performance evaluation metrics of the models developed.
Data availability statement
This manuscript has no associated data. Data used for model development can be shared upon reasonable request.