
Figures & data
Figure 1. Satellite view locating the researched proposed locations.
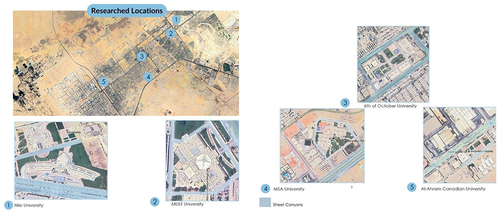
Figure 2. The chosen location shows the existing buildings and the street canyon to be studied.
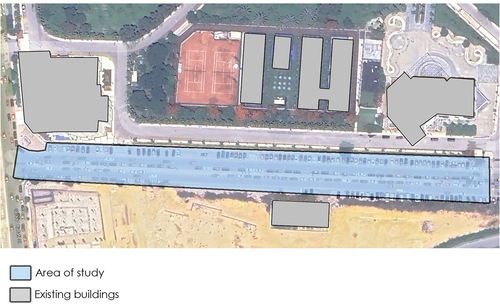
Figure 3. Analysis of weather data (temperature and direct solar radiation hourly average) on June 21st.
Source: Retrieved from climate.onebuilding.org
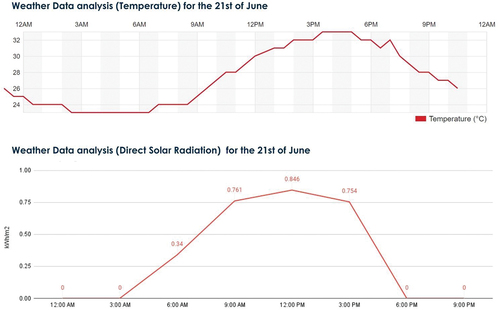
Figure 4. The chosen site’s street canyon.
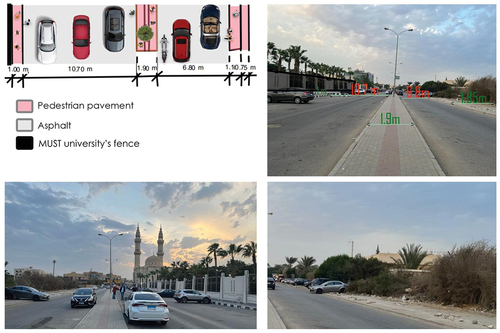
Table 1. List of observed existing trees.
Figure 5. Scenario (1).
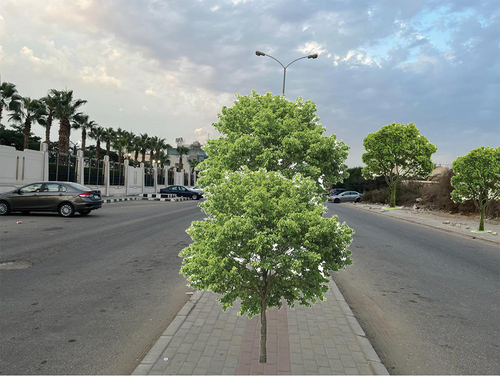
Figure 6. Scenario (2).
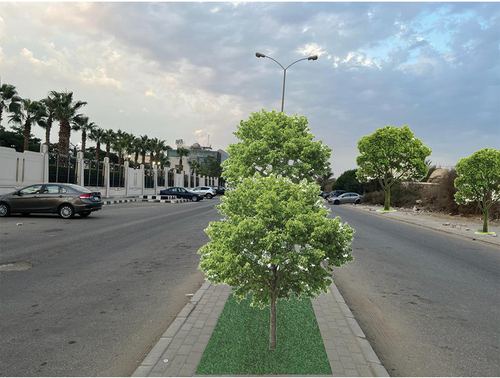
Figure 7. PMV simulations of base case as well as Scenarios 1 and 2.

Figure 8. PMV comparison for simulations applied on 21st June.
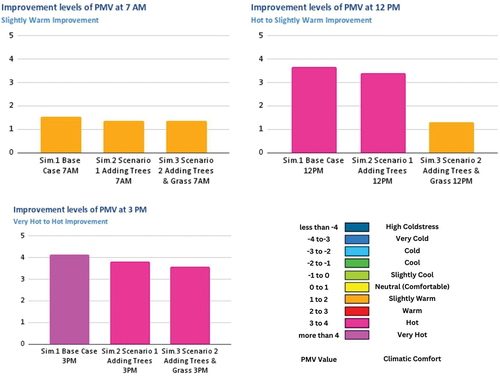
Table 2. Methodological framework checklist.