Figures & data
Figure 1. Tall building Models Designed According to Form and Facade Variables (drawn by authors).
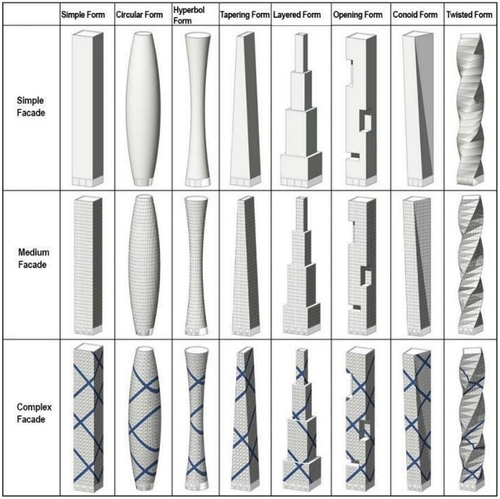
Figure 2. Land in the Ulus Region and Its Surroundings (drawn by authors).
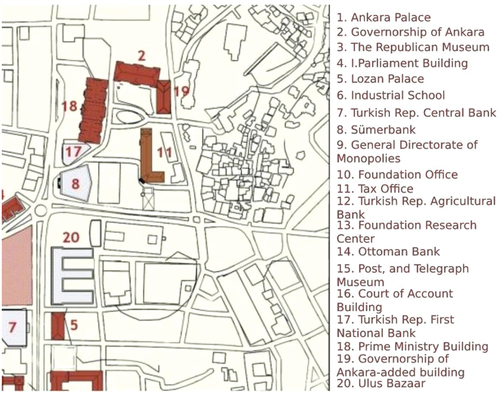
Figure 3. Land in the Kavaklıdere Region and Its Surroundings (drawn by authors).
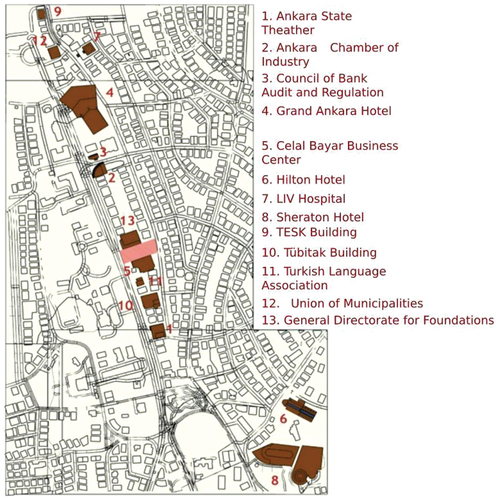
Table 1. Similarity ratios of tall buildings according to Ulus and Kavaklıdere Regions.
Table 2. Reliability values of the variables.
Table 3. Correlation and regression values of the variables.
Table 4. Anova values of the variables.
Figure 4. Relation of the facades with the dependent variables (drawn by authors).
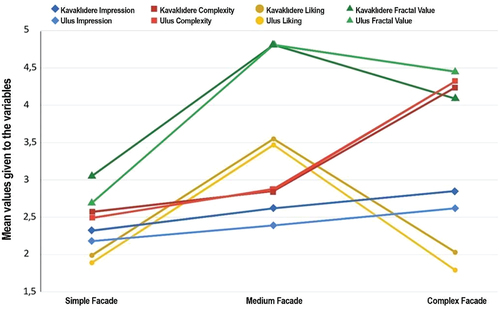
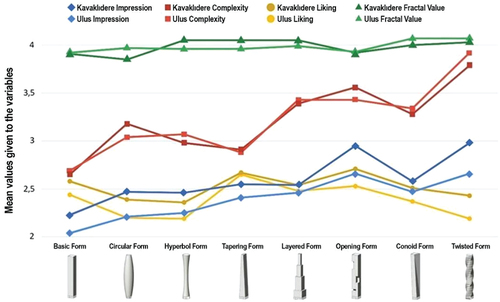
Figure 5. Relation of the forms with the dependent variables (drawn by authors).