Figures & data
Figure 1. Comparison between stress results by ABAQS and PLAXIS 3D.
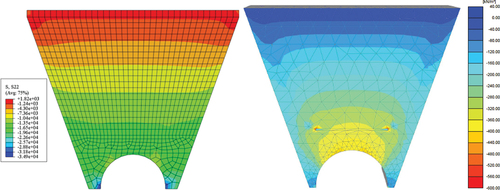
Figure 2. Comparison between displacements results by ABAQS and PLAXIS.
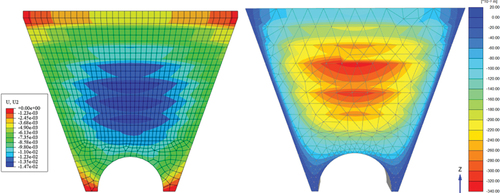
Figure 3. Schematic view of the physical model configuration for loading system.
Figure 4. Schematic S-S side view of the physical model.
Figure 5. Test setup and measurement tools.
Table 1. Comparison between properties of backfill and rubber-sand mixture.
Figure 6. Geogrid used in this study: (A) Netlon geogrid, (B) Tensile force stress diagram [Citation17].
![Figure 6. Geogrid used in this study: (A) Netlon geogrid, (B) Tensile force stress diagram [Citation17].](/cms/asset/208d8c39-fc5e-4878-a6a3-58178154e89a/thbr_a_2363731_f0006_b.gif)
Table 2. The mechanical characteristics of both the CCT prototype and the model.
Figure 7. (A) Uniaxial compression test, (B) steel mesh, (C) strain gauge on CCT.
Table 3. Testing schemes.
Figure 8. Stress strain curve for CCT under applied pressure on foundation.
Figure 9. Earth pressure on CCT under pressure footing 18Kpa along the horizontal axis.
Figure 10. Case S2 (T = 0.6 H).
Figure 11. Case S3 (T=0.9 H).
Figure 12. Case S4 (T=1.1 H).
Figure 13. Effect of using rubber-sand in earth reduction.
Figure 14. Case S5 (L=0.95 H).
Figure 15. Case S6 (L=1.1 H).
Figure 16. Case S7 (L=1.25 H).
Figure 17. Comparison between geo-grid samples.
Figure 18. Comparison between earth pressure reduction in different methods.