
Figures & data
Figure 1. Research structure and methodology.
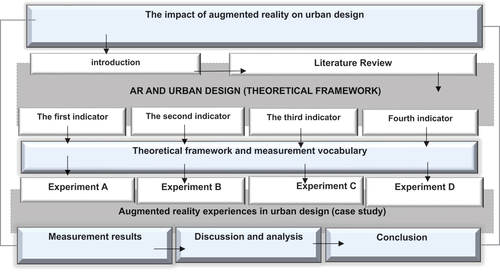
Figure 2. (left to right) the nine stations in the (smart walk), 3D virtual images accompanied the virtual tour, the virtual 3D model of the pedestrian bridge integrating into real landscape.
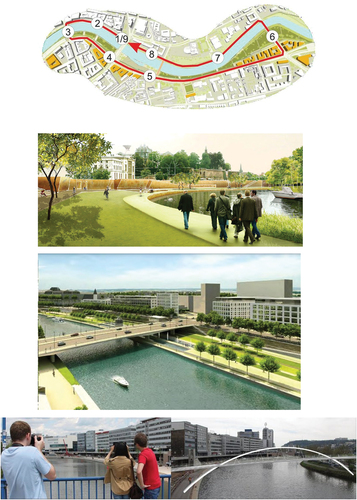
Figure 3. AR abilities to assist designers in digitally visual and spatial evaluations.
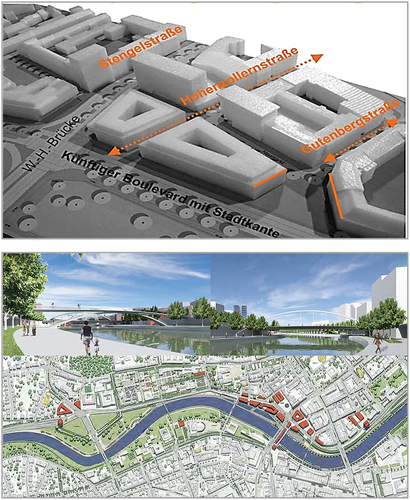
Figure 4. Using the alignment cube for placing the model on site, controlling the six indicator values through the user interface.
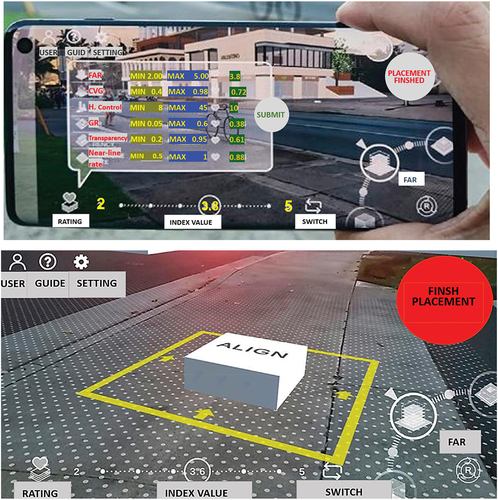
Figure 5. Three different values for each indicator from two different perspectives, A and B.
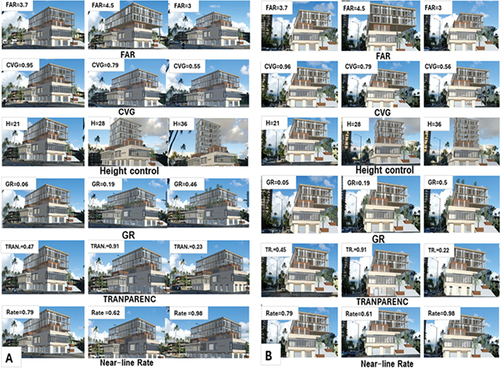
Figure 6. A preliminary questionnaire platform content.
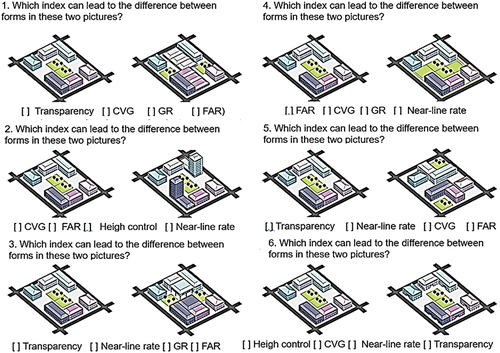
Figure 7. The first proposed scenario (2D model), the second proposed scenario (2D model).
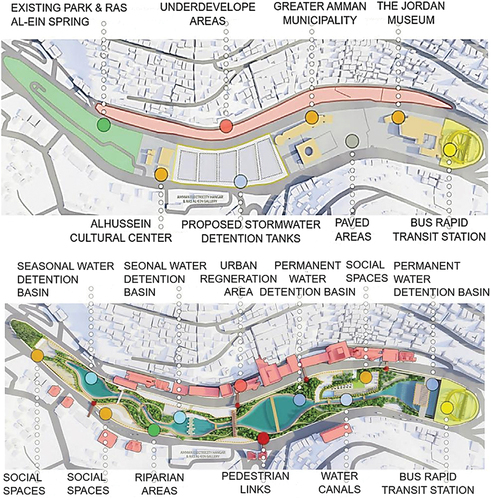
Figure 8. Displaying images accompanied by texts in the Audio-Visual History book of the seil.
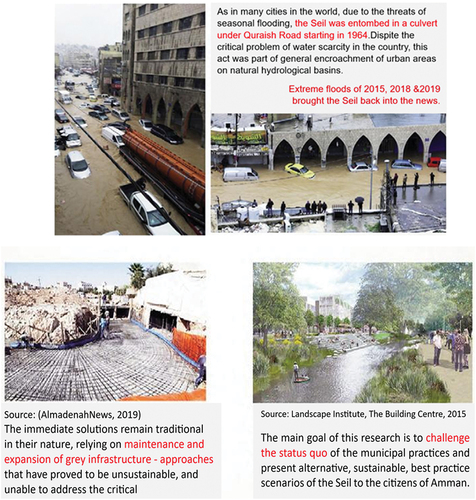
Figure 9. 3D model of the second scenario providing interactive buttons to display a 360-degree view for specific areas, 360-degree presentations of some key parts in second scenario.
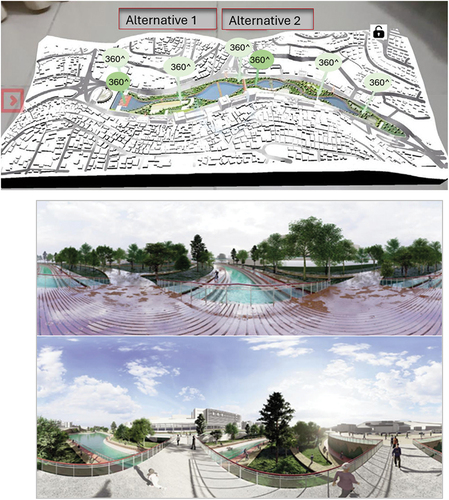
Figure 10. The main interface shows three buttons for three modes, the history mode shows abilities of selecting according to timeline, displaying a panoramic painting of an important battle.
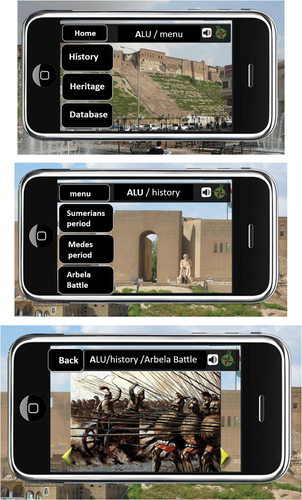
Figure 11. Heritage mode interface, activating 2D view of it, activating 3D view of it.
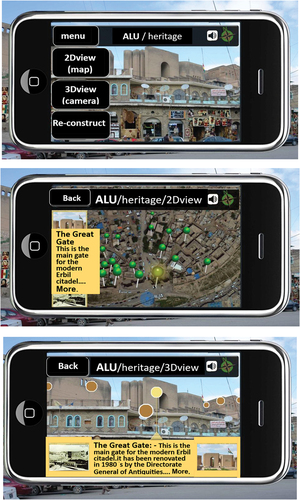
Figure 12. Reconstruction view, the abilities of activating one or more 3D models at the same time.
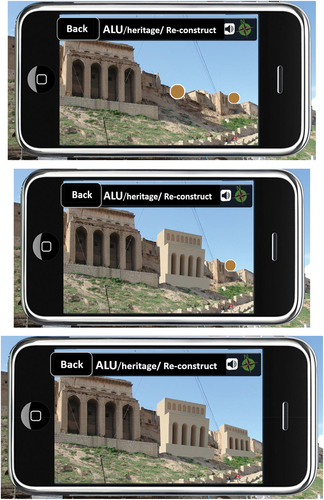
Table 1. Table of measurement.