Figures & data
Fig. 1. The conceptual foundations. Source: authors’ contribution.
Table 1. Complex Adaptive Systems.
Fig. 2. The virus–human–environment ‘system’ – complex patterned interactions create emergent phenomena associated with HIV/AIDS. Source: Burman, Aphane & Delobelle (Citation2015:16).
Table 2. Phenomena that emerge from within components or between components of the human–virus–environment heuristic.
Fig. 3 The Cynefin framework. Source: http://en.wikipedia.org/wiki/Cynefin.
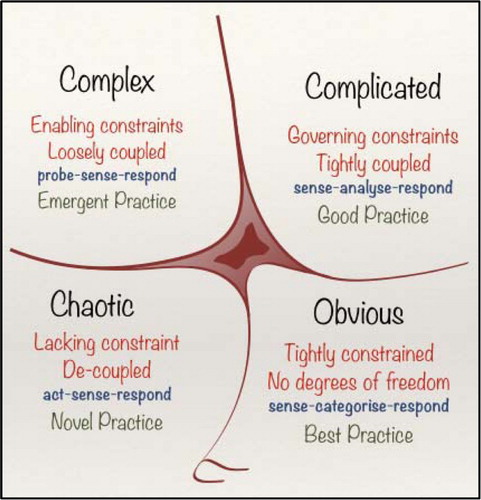
Table 3. The Cynefin framework and HIV/AIDS.
Table 4. Themes that were surfaced through the Archetype Extraction technique.
Fig. 4. The Vicious Tollgate: surfacing Whoonga in 2011. Source: authors’ contribution.
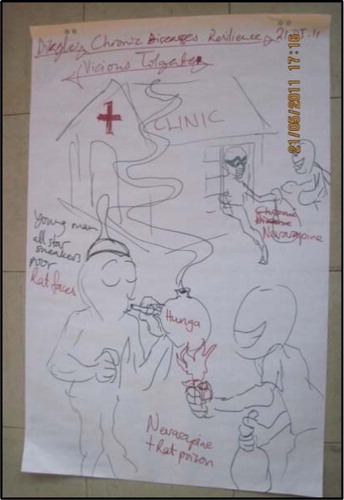
Fig. 5. The ‘Opinionated Idiot’ archetype. Source: authors’ contribution.
Fig. 6. The Cycle of Treatment-Seeking Behaviour in Ga-Dikgale. Source: authors’ contribution.
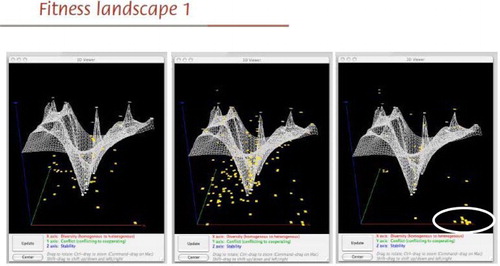
Fig. 7. Development themes coded by ‘regularity’ (n = 1087 micro-narratives). Source: authors’ contribution.
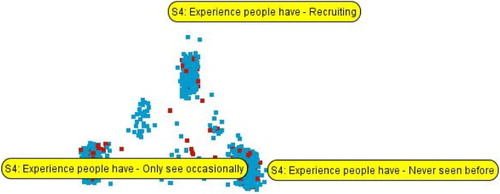
Fig. 8. The same data filtered by ‘something the community will never accept. Source: authors’ contribution.
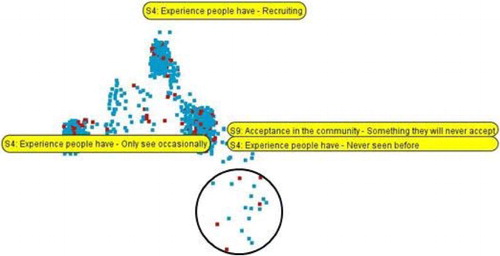
Fig. 9. The same data when viewed through ‘Landscape’. Source: authors’ contribution.
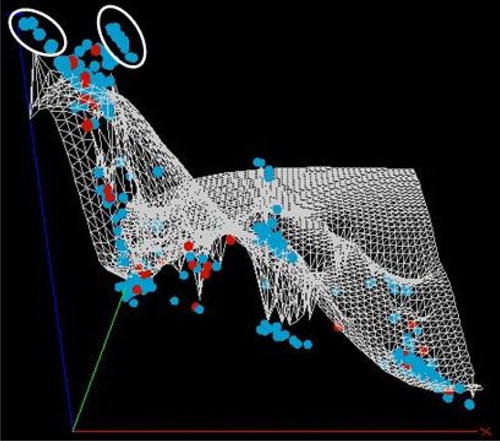
Fig. 10. Themes from Uganda and Kenya and the number of beds per clinic represented by the size of the circle. Source: Maxmeister (Citation2014).
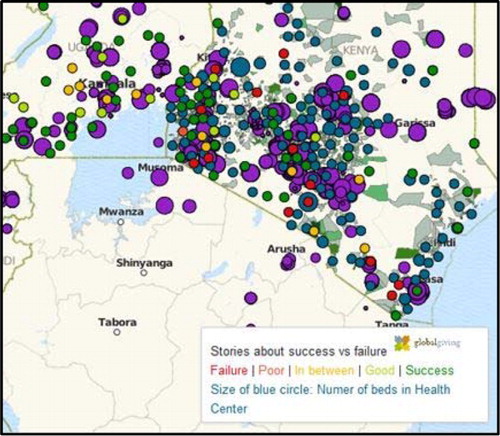
Fig. 11. The number of times different themes were mentioned in micro-narratives in the GlobalGiving project. Source: Maxmeister (Citation2014).
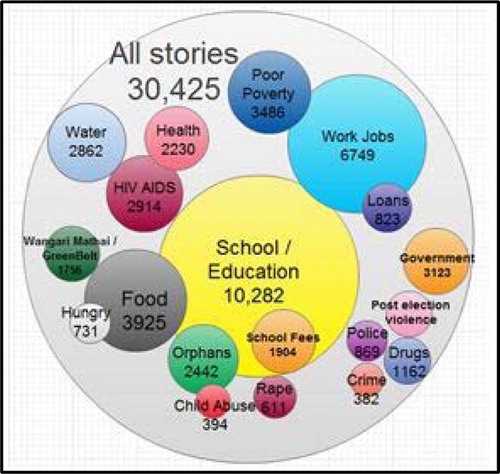
Fig. 12. Historical data using Landscape. Source: Cognitive Edge training materials, available at http://cognitive-edge.com/uploads/presentations/CE%20Accreditation%20SENSEMAKER%20feb%2008.pdf. Reproduced with permission.