Figures & data
Figure 1. Map of participant practice locations around Maputo City.
Note: Red pin locations and numbers indicate location and number of participants from this neighbourhood. Blue ‘H’ demonstrates location of hospital. Map Data: © 2016 Google. The street map and hospital locations are freely available on maps.google.com. Permission was not required to reproduce this map image.
![Figure 1. Map of participant practice locations around Maputo City.Note: Red pin locations and numbers indicate location and number of participants from this neighbourhood. Blue ‘H’ demonstrates location of hospital. Map Data: © 2016 Google. The street map and hospital locations are freely available on maps.google.com. Permission was not required to reproduce this map image.](/cms/asset/2a2fb017-61c7-47d5-9a14-3bb9f33dfbf1/rsah_a_1909492_f0001_oc.jpg)
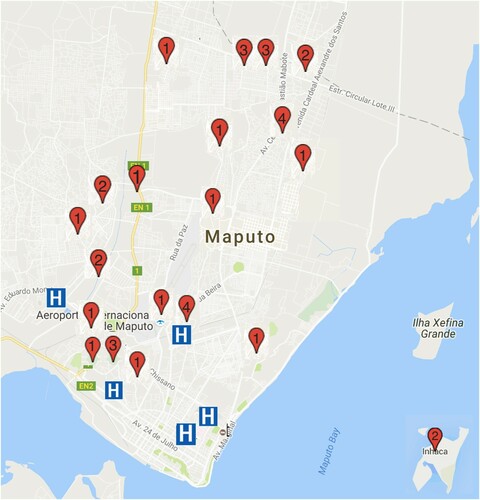
Table 1. Characteristics of study participants (N = 36)