
Figures & data
Table 1. Fit indices for the 5- and 6-factor DIDS CFA models, T1–T3 (N = 437).
Figure 1. Standardized estimates for the DIDS measurement model at T1.
Note: Factor covariances have been omitted for the sake of clarity.
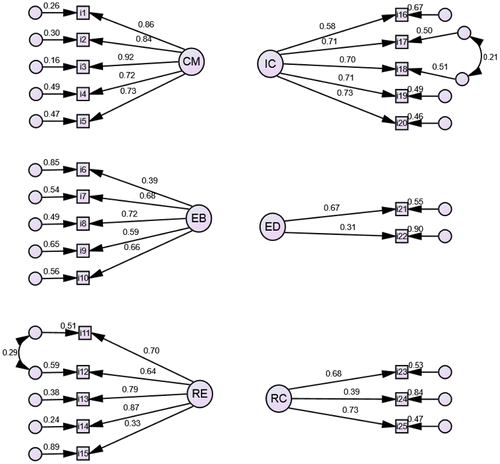
Table 2. Descriptive statistics for the six DIDS scales, T1–T3.
Table 3. Fit indices for testing longitudinal measurement invariance of the 6 factor DIDS (N = 437).
Table 4. Cross-sectional bivariate correlations between DIDS dimensions, symptoms of depression, anxiety, and self-esteem, T1/T2/T3.
Supplemental material