Figures & data
Graph 1. Circulation 1985–2019. According to IVC Brasil, the figure for the reported ‘circulation’ of a publication is the gross number of printed copies. (IstoÉ magazine has not been affiliated to the IVC since mid-2015, for which there is therefore is no data from 2016 onwards.) While this is what appears on the graph, it is worth noting that this figure does not coincide with the number of copies that actually reach the hands of readers, whether through subscriptions, separate sales, targeted distribution, or indeed through shared use. Source: IVC – Circulation Verification Institute.
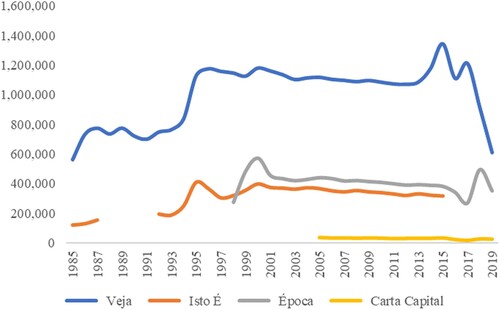
Figure 1. issue 30/12/2015. Source: Veja archive.
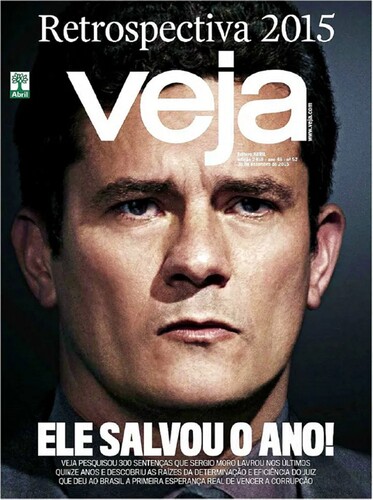
Figure 2. issue 09/03/2016. Source: Veja archive.

Figure 3. issue 16/03/2016. Source: Veja archive.
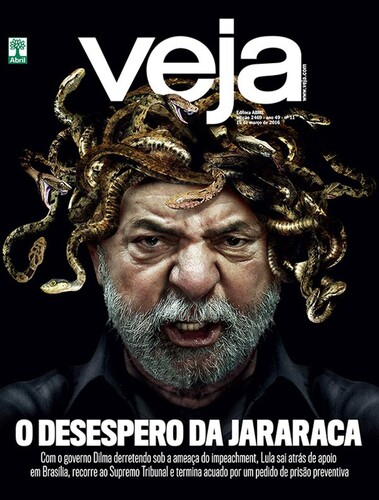
Figure 4. issue 23/03/2016. Source: Veja archive.
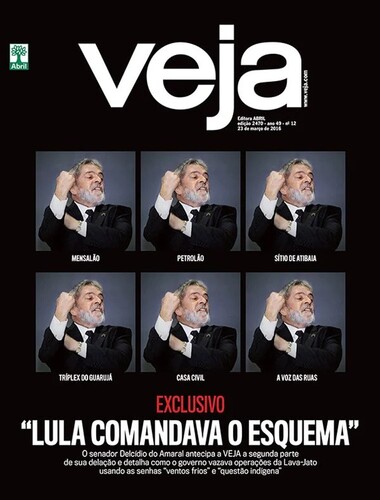
Figure 5. issue 20/04/2016. Source: Veja archive.
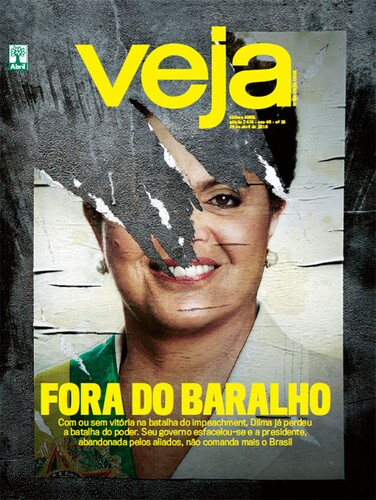
Figure 6. issue 8/11/2017. Source: Veja archive.
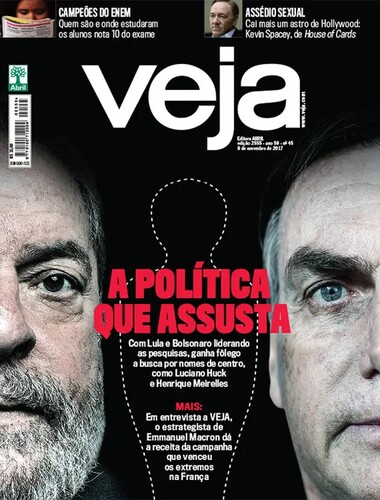
Figure 7. issue 11/04/2018. Source: Veja archive.
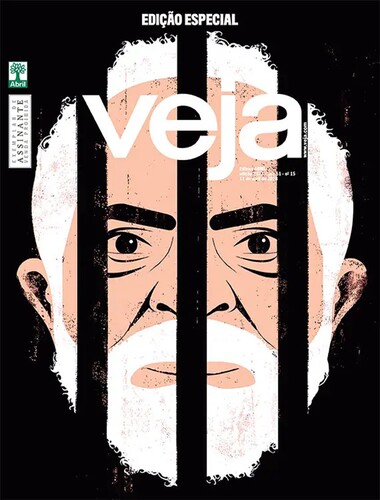
Figure 8. issue 17/10/2018. Source: Veja archive.
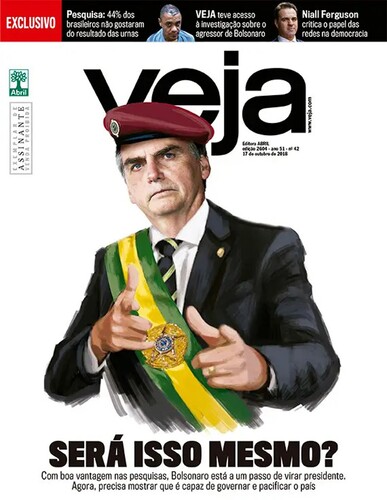
Figure 9. issue 07/11/2018. Source: Veja archive.
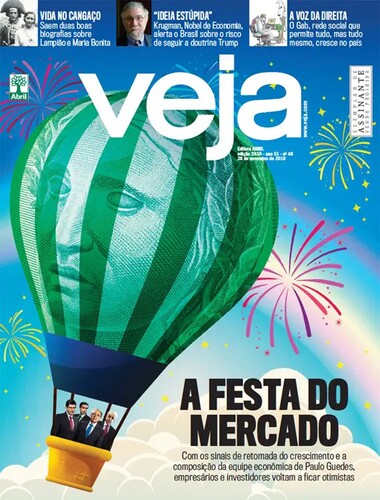
Figure 10. issue 28/11/2018. Source: Veja archive.

Figure 11. issue 19/06/2019. Source: Veja archive.
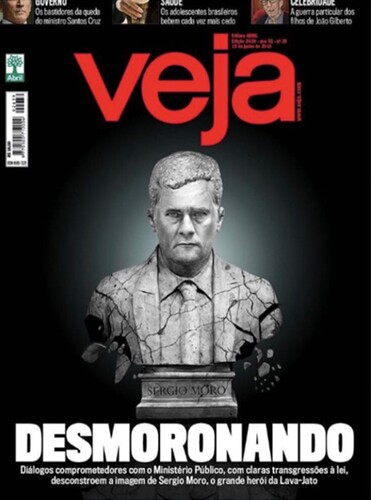
Figure 12. issue 03/03/2021. Source: Veja archive.