
Figures & data
Figure 1. Autonomy-Supportive Teaching, Harmonious Passion, and Obsessive Passion Broken Down by Experimental Condition and Time of Assessment (Study 1). Note. Numbers represent means and, in parentheses, standard deviations.
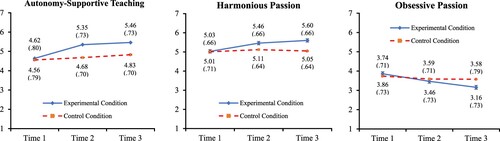
Table 1. Descriptive Statistics and Intercorrelations Among All Study 1 Variables.
Figure 2. Standardized Parameter Estimates for the Test of the Hypothesized Model (Study 2). Note. Solid lines represent statistically significant paths (p < .05). Dashed lines represent statistically nonsignificant paths. Numbers are standardized beta coefficients.
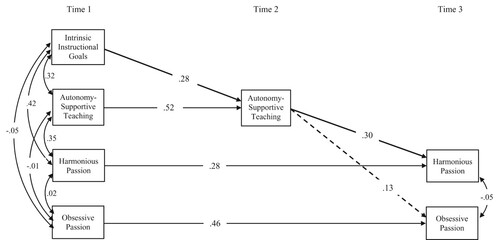
Table 2. Descriptive Statistics and Intercorrelations Among All Study 2 Variables.
Supplemental material