Figures & data
Figure 1. Multilevel CFD parallelization. Interconnection of first (main/masters) and second (master/slaves) parallelization levels.
Figure 2. ONERA M6 wing. Chordwise pressure distribution at wing span station Y = 0.53. α = 3.06○, M = 0.84, Re=11.72×10⁶. Solid and dashed lines – present computation; crosses – experimental data Citation[17].
![Figure 2. ONERA M6 wing. Chordwise pressure distribution at wing span station Y = 0.53. α = 3.06○, M = 0.84, Re=11.72×10⁶. Solid and dashed lines – present computation; crosses – experimental data Citation[17].](/cms/asset/5e0d60d0-a259-480d-b38a-1fe1eb5d7749/gipe_a_10051911_f0002.gif)
Figure 3. ONERA M6 wing. Chordwise pressure distribution at wing span station Y = 0.78. α = 3.06○, M = 0.84, Re=11.72×10⁶. Solid and dashed lines – present computation; crosses – experimental data Citation[17].
![Figure 3. ONERA M6 wing. Chordwise pressure distribution at wing span station Y = 0.78. α = 3.06○, M = 0.84, Re=11.72×10⁶. Solid and dashed lines – present computation; crosses – experimental data Citation[17].](/cms/asset/eb0d593d-12f5-4210-ad88-f016eef79f7c/gipe_a_10051911_f0003.gif)
Figure 4. Airfoil shapes optimized on the coarse (1 lev dc) and medium (2 lev dc) grids vs original RAE 2822 profile.
Figure 5. Airfoil optimized on the medium grid at the flight conditions CL=0.0, M = 0.6. Surface pressure distribution at the design point.
Table 1. Drag reduction (counts) for multipoint transonic test case. Comparison between current optimization (OPTIMAS) and the results by Quagliarella [19]. 1 aerodynamic count = 0.0001.
Figure 6. Drag polars at M = 0.60. One-point and two-point optimizations vs original airfoil.
Figure 7. Profile shape. One-point and two-point optimizations vs original airfoil.
Figure 8. Original airfoil of 18% thickness. Surface pressure distribution.
Figure 9. One-point optimization of 18% thickness. Surface pressure distribution.
Table 2. Optimization conditions and constraints for different test cases.
Figure 10. Original ONERA M6 wing. Pressure distribution on the upper surface of the wing at M = 0.84, CL=0.265.
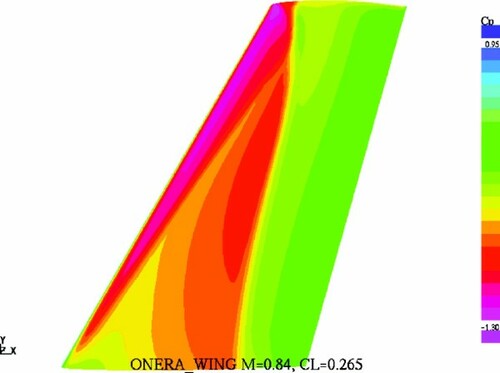
Figure 11. One-point optimization – Case_1. Pressure distribution on the upper surface of the wing at M = 0.84, CL=0.265.
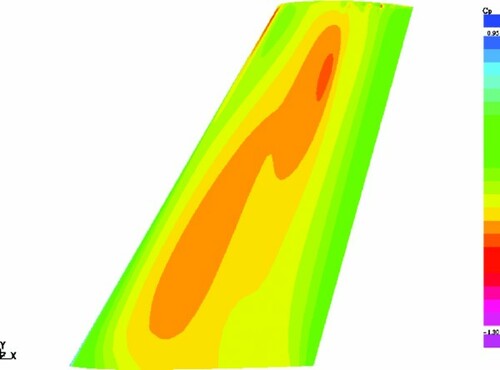
Figure 12. Drag polars at M = 0.84. Original ONERA M6 wing vs. optimized wing (Case_1) at different optimization steps.
Figure 13. Drag polars of the optimized wing (Case_1) at different free-stream Mach numbers.
Figure 14. Original ONERA M6 wing. Pressure distribution on the upper surface of the wing at M = 0.87, CL=0.5.
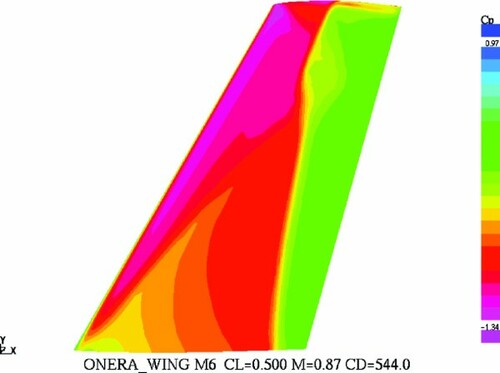
Figure 15. One-point optimization – Case_4. Pressure distribution on the upper surface of the wing at M = 0.87, CL=0.5.
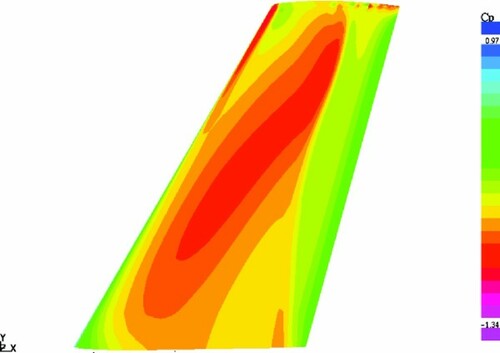
Figure 16. Original ONERA M6 wing. Chordwise pressure distribution at the midsection of the wing at M = 0.87, CL=0.5.
Figure 17. One-point optimization – Case_4. Chordwise pressure distribution at the midsection of the wing at M = 0.87, CL=0.5.
Figure 18. Mach off-design behaviour of the optimized wing (Case_4). Drag polars at different Mach numbers.
Figure 19. Mach off-design behaviour of optimized wings. Drag polars at different Mach numbers. Case_3 vs. Case_4.
Figure 20. Mach drag divergence of the optimized wings versus the original ONERA M6 wing. Case_2, Case_3 and Case_4 correspond to design M=0.84, 0.86 and 0.87 respectively.
Figure 21. Lift/drag curves at M = 0.87. ONERA M6 wing vs. one-point optimizations with different values of constraint on the pitching moment. Case_4: no constraint on CM; Case_5, Case_9 and Case_10: CM≥ -0.1; Case_6: CM≥ -0.075.
Figure 22. Shape of optimized wings at root section for Nws=2 (Case_5), Nws=3 (Case_9) and Nws=4 (Case_10).
Figure 23. Shape of optimized wings at tip section for Nws=2 (Case_5), Nws=3 (Case_9) and Nws=4 (Case_10).
Figure 24. Shape of the optimized wings at midsection for different values of constraint on pitching moment. Case_8 – no constraint on CM; Case_9 – CM>-0.1. Nws=3.
Figure 25. Drag polars at M = 0.87. One-point optimization vs. two-point optimization.