Figures & data
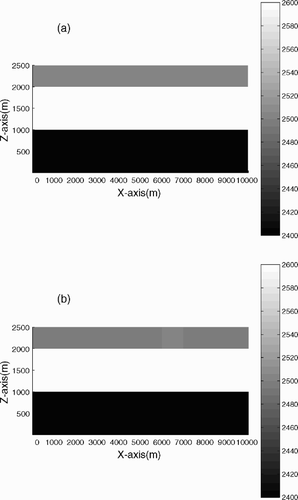
Figure 1. The velocity of model (I). (a) The true value of the velocity. (b) The inversion result. (c) The inversion result when 15% noise is added.
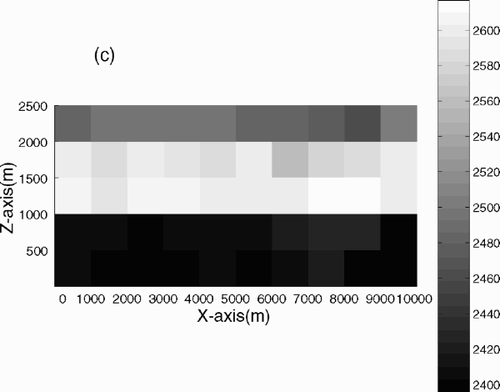
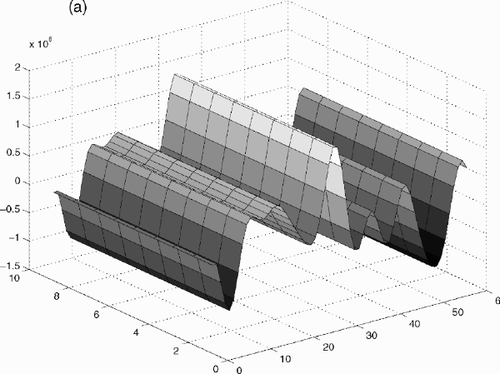
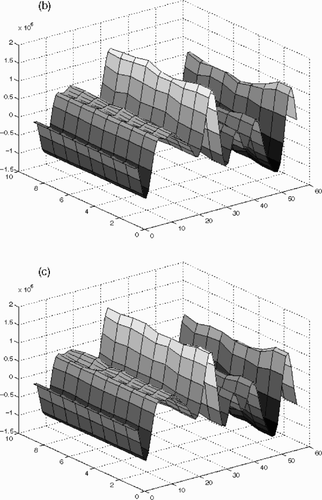
Figure 2. Comparison of seismic of model (I). (a) The real seismograms. (b) The synthetic data. (c) The real seismograms after 15% noise is added.
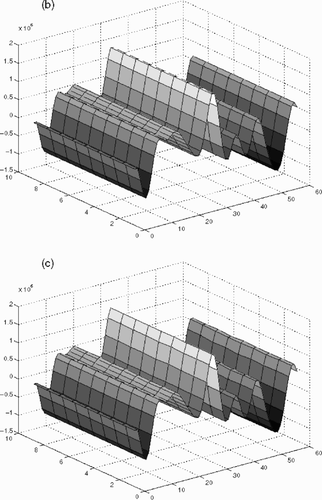
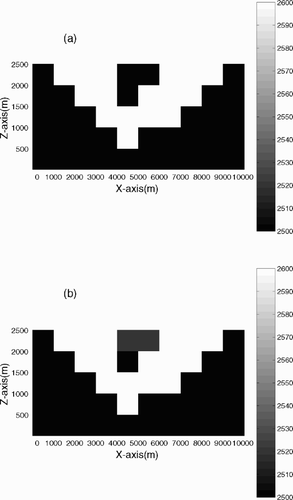
Figure 3. The velocity of model (II). (a) The true value of velocity. (b) The inversion result. (c) The inversion result when 15% noise is added.
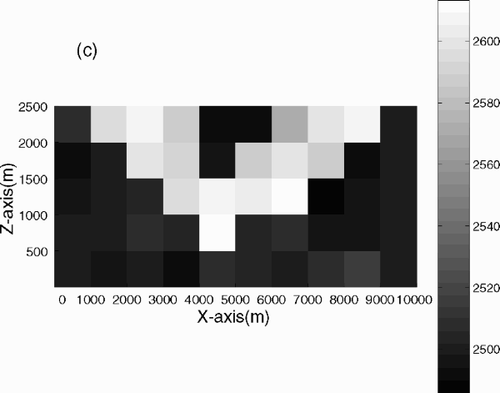
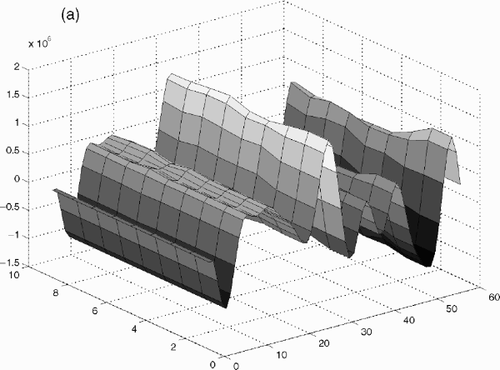
Figure 4. Comparison of seismic of model (II). (a) The real seismograms, (b) The synthetic data. (c) The real seismograms after 15 % noise is added.