Figures & data
Figure 1. (a) Regular GA. (b) Distribution strategies.
Figure 2. (a) NACA0012 and lower surface modified airfoil (airfoil-1). (b) NACA0012 and upper surface modified airfoil (airfoil-2). (c) Upper surface Cp distribution for NACA 0012 and modified airfoils.
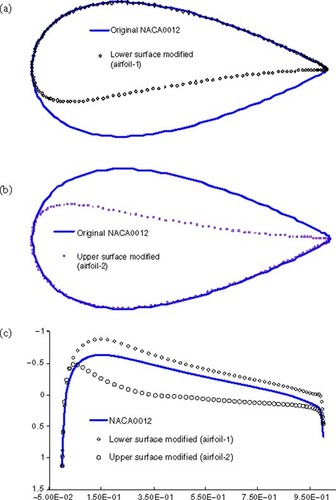
Figure 3. Variation of error ratio with respect to Mach number.
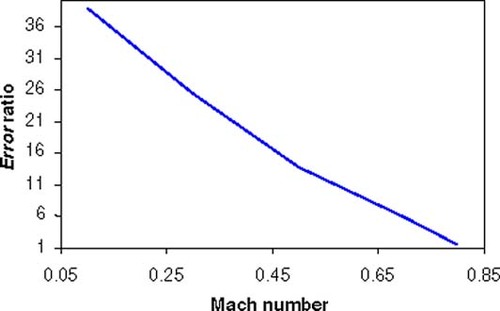
Figure 4. Test history for the Griewank function.
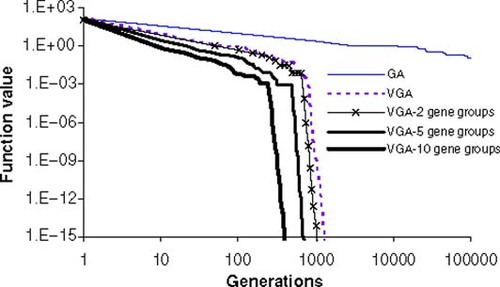
Figure 5. Bezier curve representation of NACA4412 airfoil.
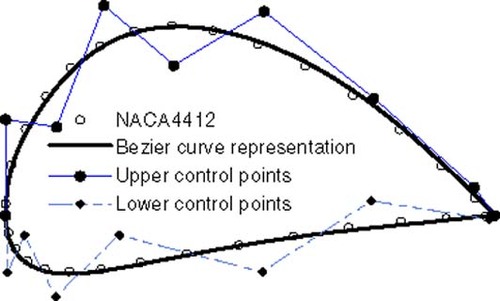
Figure 6. Initial population.
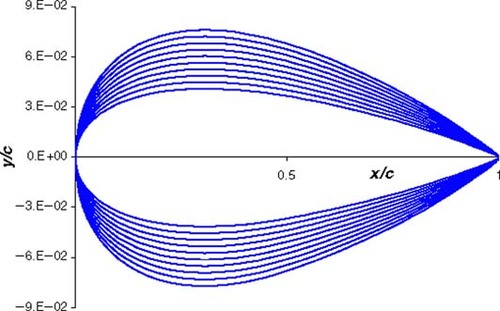
Figure 7. Comparison of best fitness values for different strategies (Case I).
Figure 8. (a) Calculated and target airfoils (Case I). (b) Calculated and target Cp distributions (Case I).
Figure 9. Comparison of best fitness values for different strategies (Case II).
Figure 10. (a) Calculated and target airfoils (Case II). (b) Calculated and target Cp distributions (Case II).
Figure 11. Comparison of best fitness values for different strategies (Case III).
Figure 12. (a) Calculated and target airfoils (Case III). (b) Calculated and target Cp distributions (Case III).