139
Views
0
CrossRef citations to date
0
Altmetric
Original Articles

An inverse solution to functional brain mapping in language processing using an eigensystem study

, , &
Pages 437-452 | Received 10 Jan 2005, Accepted 21 May 2005, Published online: 26 Jan 2007

Figures & data

Figure 1. ESI-256 system components: (a) ESI-256 system (eight SynAmp amplifiers, host computer, and display monitor), (b) eight head boxes (pre-amplifiers).
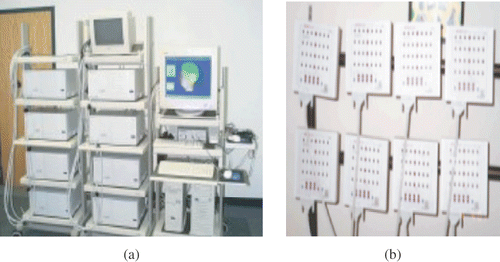
Figure 1. ESI-256 system components: (a) ESI-256 system (eight SynAmp amplifiers, host computer, and display monitor), (b) eight head boxes (pre-amplifiers).

Figure 2. Amplifiers and head boxes.

Figure 2. Amplifiers and head boxes.

Figure 3. Interface showing electrode labels used in the experiment.

Figure 3. Interface showing electrode labels used in the experiment.

Figure 4. Continuous EEG data recorded.

Figure 4. Continuous EEG data recorded.

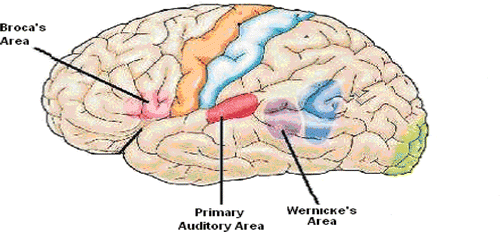
Figure 5. Brain's areas involved in language/comprehension.

Figure 5. Brain's areas involved in language/comprehension.

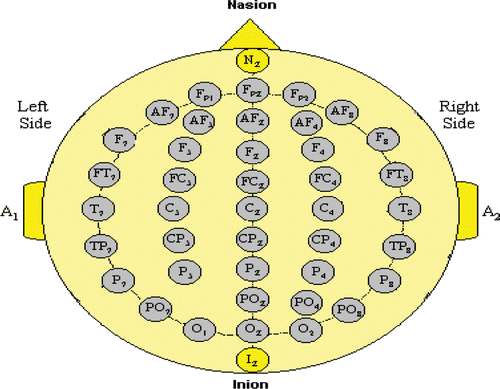
Figure 6. Electrode placement.

Figure 6. Electrode placement.

Table 1. Standard region definitions and corresponding electrodes

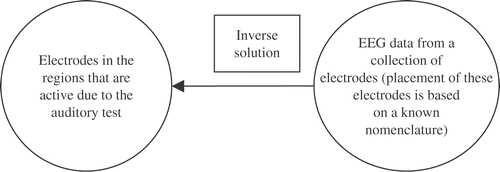
Figure 7. Representation of the inverse problem about finding the collection of electrode sets.

Figure 7. Representation of the inverse problem about finding the collection of electrode sets.

Figure 8. Centroids of activity of the right and left hemispheres for all patients in terms of auditory (left) vs. response (right) phases.
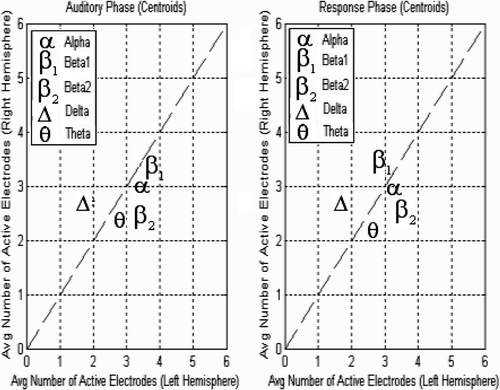
Figure 8. Centroids of activity of the right and left hemispheres for all patients in terms of auditory (left) vs. response (right) phases.

Figure 9. Illustrative frequency activities in five subjects during auditory/comprehension task. Black corresponds to red as mentioned in the text, and dark gray corresponds to blue. (Colour version available online.)
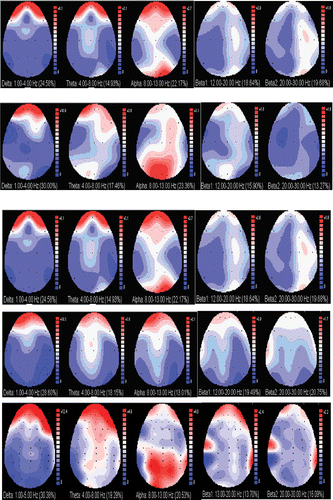
Figure 9. Illustrative frequency activities in five subjects during auditory/comprehension task. Black corresponds to red as mentioned in the text, and dark gray corresponds to blue. (Colour version available online.)
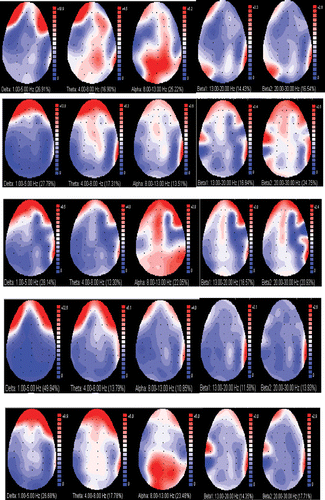
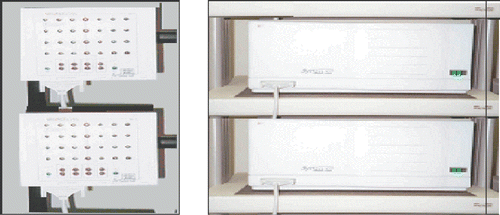
Figure 10. Illustrative frequency activities in five subjects during answer task. Black corresponds to red as mentioned in the text, and dark gray corresponds to blue. (Colour version available online.)
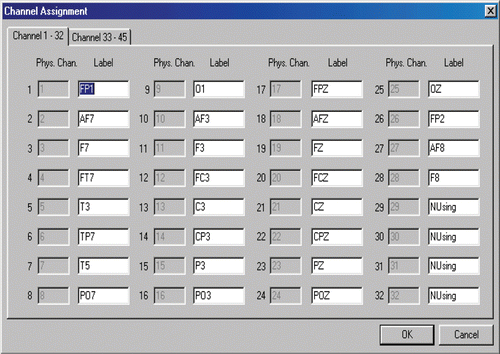
Figure 10. Illustrative frequency activities in five subjects during answer task. Black corresponds to red as mentioned in the text, and dark gray corresponds to blue. (Colour version available online.)
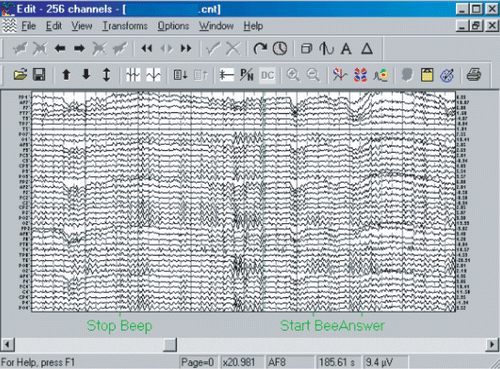
Table 2. Standard deviation of the eigenvalues of the different regions during listening task for the nine subjects

Table 3. Standard deviation of the eigenvalues of the different regions during answering task for the nine subjects

Table 4. Final analysis (auditory phase)

Table 5. Final analysis (response phase)

Reprints and Corporate Permissions

Please note: Selecting permissions does not provide access to the full text of the article, please see our help page How do I view content?

To request a reprint or corporate permissions for this article, please click on the relevant link below:

Academic Permissions

Please note: Selecting permissions does not provide access to the full text of the article, please see our help page How do I view content?

Obtain permissions instantly via Rightslink by clicking on the button below:

If you are unable to obtain permissions via Rightslink, please complete and submit this Permissions form. For more information, please visit our Permissions help page.