319
Views
12
CrossRef citations to date
0
Altmetric
Original Articles

Finite element formulation for shear modulus reconstruction in transient elastography

&
Pages 605-626 | Received 19 Sep 2007, Accepted 07 Jul 2008, Published online: 19 Jun 2009

Figures & data

Figure 1. Schematic of transient elastography experiment performed in the laboratory of Mathias Fink Citation5. Vibrating rods set up propagating waves. The vertical displacement component, resulting from the propagating waves, as a function of time is recorded on the imaging plane.
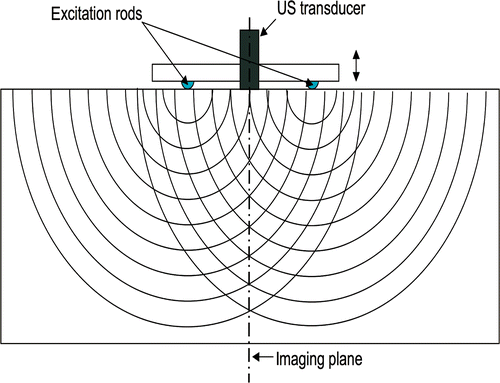
Figure 1. Schematic of transient elastography experiment performed in the laboratory of Mathias Fink Citation5. Vibrating rods set up propagating waves. The vertical displacement component, resulting from the propagating waves, as a function of time is recorded on the imaging plane.

Figure 2. Image of raw displacement data used for this study showing propagating shear waves. Waves propagate from top to bottom surface. Only the downward displacement component is measured, in μm. Available in colour online.
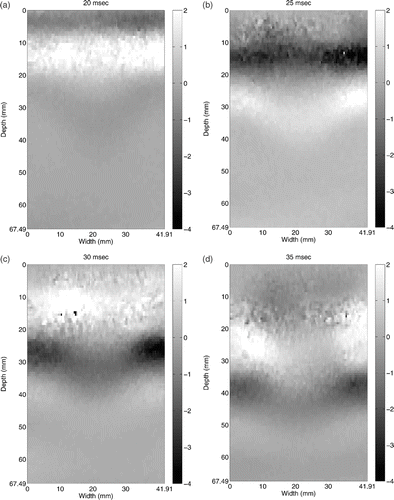
Figure 2. Image of raw displacement data used for this study showing propagating shear waves. Waves propagate from top to bottom surface. Only the downward displacement component is measured, in μm. Available in colour online.

Figure 3. Fourier transformed displacement component along downward direction from ultrasound measurement (in μm). Although the central frequency of the excitation is 60 Hz, the dominant frequency of the time harmonic response is at 70.71 Hz. Available in colour online.
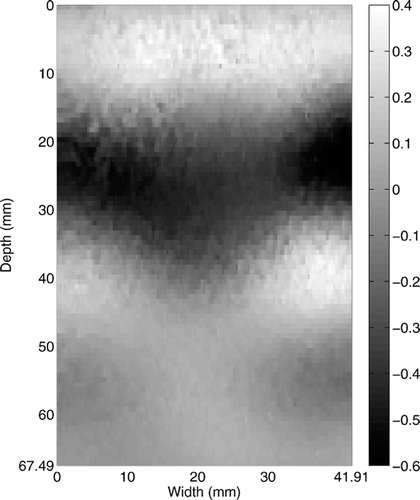
Figure 3. Fourier transformed displacement component along downward direction from ultrasound measurement (in μm). Although the central frequency of the excitation is 60 Hz, the dominant frequency of the time harmonic response is at 70.71 Hz. Available in colour online.

Figure 4. Smoothed Fourier transform of the displacements as a result of the minimization of Equation (22): (a) Smoothed vertical displacement, (b) reconstructed horizontal displacement from vertical displacement (in μm). Available in colour online.
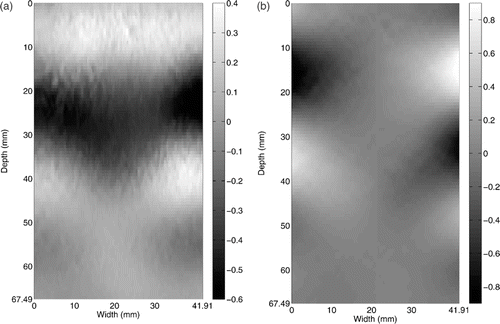
Figure 4. Smoothed Fourier transform of the displacements as a result of the minimization of Equation (22): (a) Smoothed vertical displacement, (b) reconstructed horizontal displacement from vertical displacement (in μm). Available in colour online.

Figure 5. Strain values obtained using averaging derivative method (×10−3): (a) εxx, (b) εyy (c) εxy. Vertical and horizontal directions are defined as X and Y directions, respectively. Available in colour online.
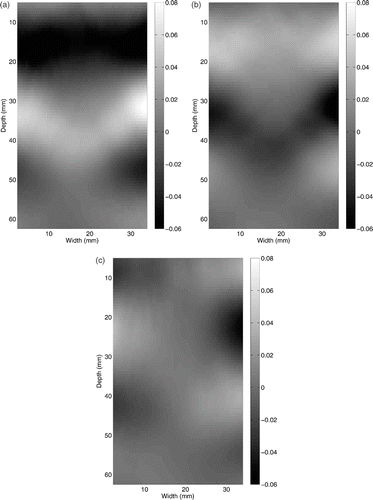
Figure 5. Strain values obtained using averaging derivative method (×10−3): (a) εxx, (b) εyy (c) εxy. Vertical and horizontal directions are defined as X and Y directions, respectively. Available in colour online.

Figure 6. Diagram showing domain decomposition for reconstructing the shear modulus field.

Figure 6. Diagram showing domain decomposition for reconstructing the shear modulus field.

Figure 7. Vertical and horizontal displacements at 20 ms, ((a) and (b)) and at 30 ms ((c) and (d)), respectively (in μm). Horizontal displacement is reconstructed using Equation (22). Available in colour online.
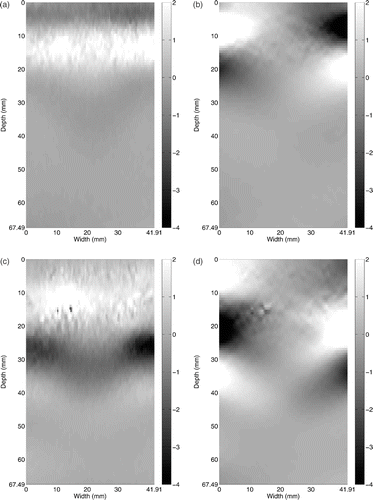
Figure 7. Vertical and horizontal displacements at 20 ms, ((a) and (b)) and at 30 ms ((c) and (d)), respectively (in μm). Horizontal displacement is reconstructed using Equation (22). Available in colour online.

Figure 8. Snapshot of computed strain values (×10−3) (a) εxx, (b) εyy and (c) εxy, and velocities (μm s−1) (d) dux/dt and (e) duy/dt, where X and Y are the vertical and horizontal directions, respectively. Available in colour online.
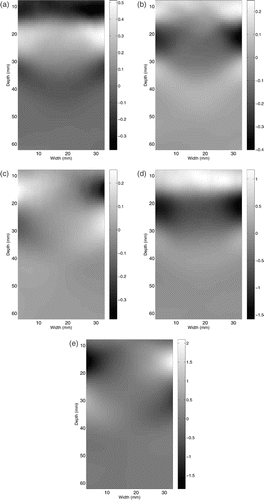
Figure 8. Snapshot of computed strain values (×10−3) (a) εxx, (b) εyy and (c) εxy, and velocities (μm s−1) (d) dux/dt and (e) duy/dt, where X and Y are the vertical and horizontal directions, respectively. Available in colour online.

Figure 9. Shear modulus reconstructions recovered using (a) the frequency domain inversion algorithm, and (b) the temporal domain inversion algorithm (kPa). Available in colour online.
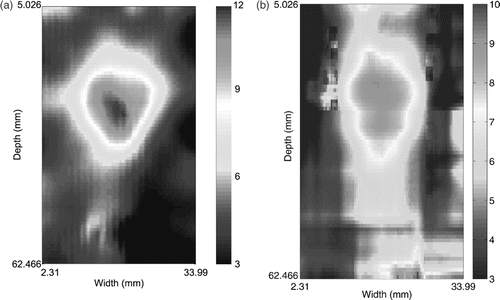
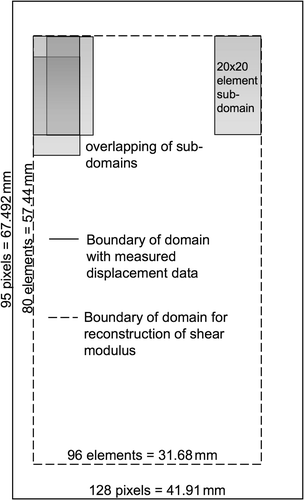
Figure 9. Shear modulus reconstructions recovered using (a) the frequency domain inversion algorithm, and (b) the temporal domain inversion algorithm (kPa). Available in colour online.

Reprints and Corporate Permissions

Please note: Selecting permissions does not provide access to the full text of the article, please see our help page How do I view content?

To request a reprint or corporate permissions for this article, please click on the relevant link below:

Academic Permissions

Please note: Selecting permissions does not provide access to the full text of the article, please see our help page How do I view content?

Obtain permissions instantly via Rightslink by clicking on the button below:

If you are unable to obtain permissions via Rightslink, please complete and submit this Permissions form. For more information, please visit our Permissions help page.