Figures & data
Figure 1. The occurrence of IH at the ETSDA.
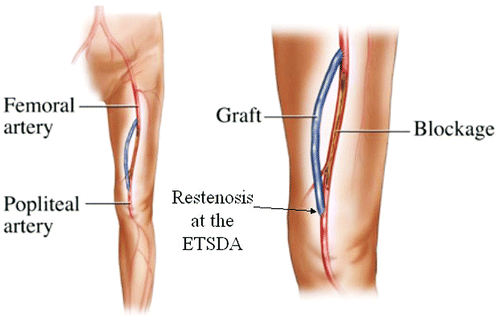
Figure 2. The ETSDA sites of IH localization.
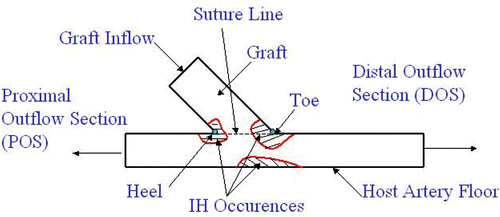
Figure 3. The local topology of (a) a boundary data centre and (b) and interior data centre.
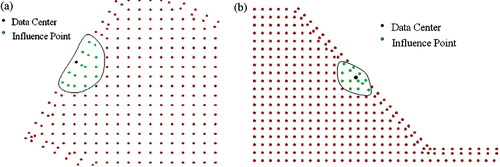
Figure 4. The automated pre-processor output.
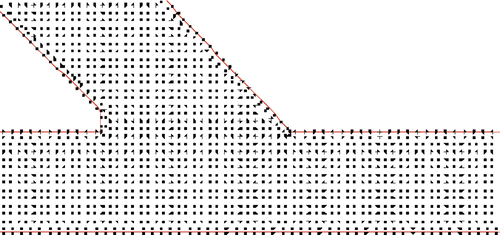
Figure 5. The order independence between the boundary and internal points.
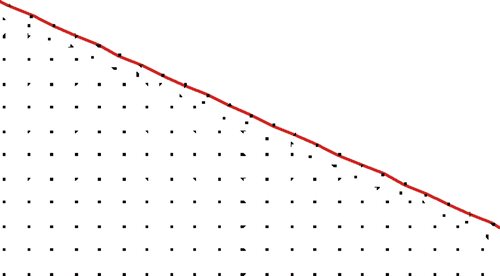
Figure 6. The schematics of the three bypass graft ETSDA geometries.
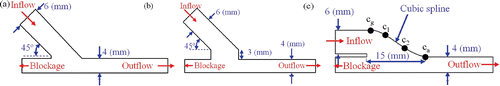
Figure 7. The meshless point distribution.
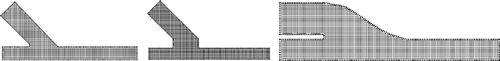
Figure 8. The FVM meshes.
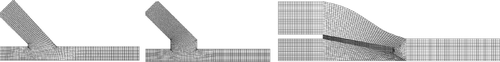
Figure 9. Conventional ETSDA model meshless (a) and FVM (b) velocity magnitude contours.
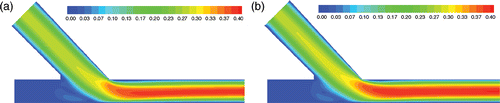
Figure 10. Miller Cuff ETSDA model meshless (a) and FVM (b) velocity magnitude contours.
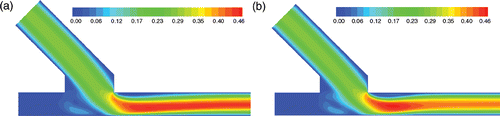
Figure 11. Hood ETSDA model meshless (a) and FVM (b) velocity magnitude contours. Available in colour online.
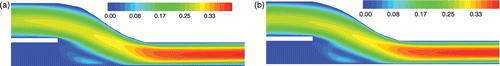
Figure 12. The x-velocity profiles and WSS locations for the three ETSDA models.
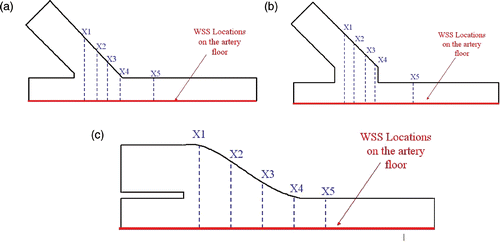
Figure 13. The x-velocity profiles for the three ETSDA models.
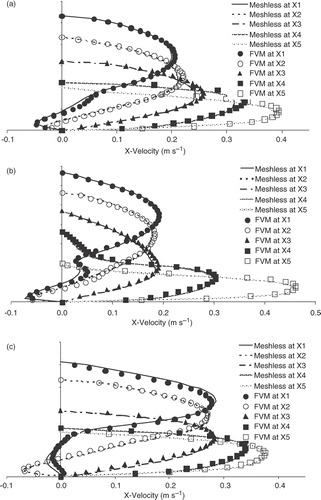
Figure 14. Meshless and FVM WSS plots at the artery floor for all the three ETSDA models.
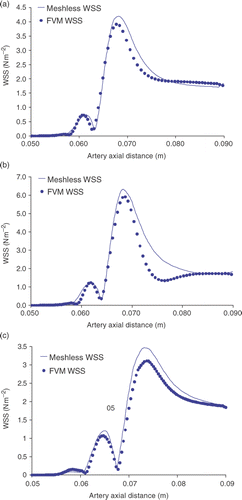
Figure 15. Example of an individual characterized by four genes encoded in a chromosome.
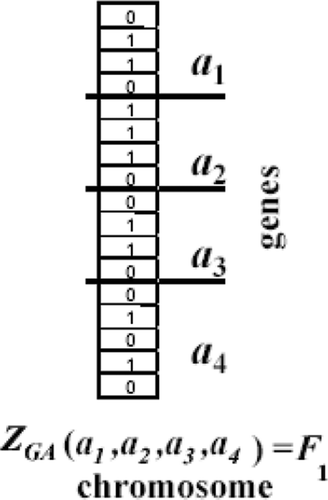
Figure 16. The IPL flowchart.
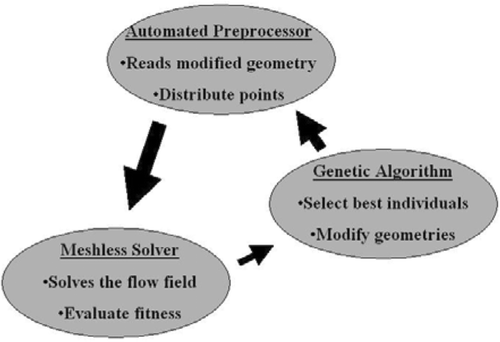
Figure 17. The conventional ETSDA model generatrix.
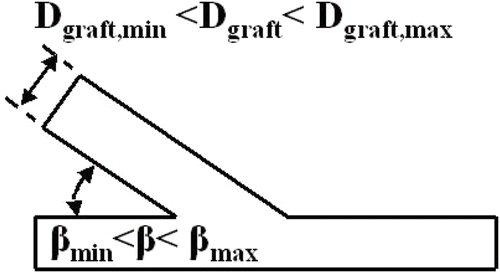
Figure 18. The convergence history for all the conventional ETSDA model cases.
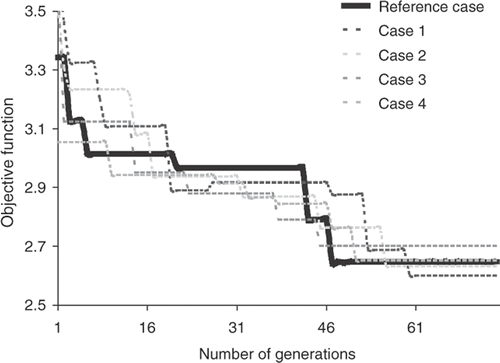
Figure 19. SWSSG plots for the standard and optimized conventional ETSDA models.
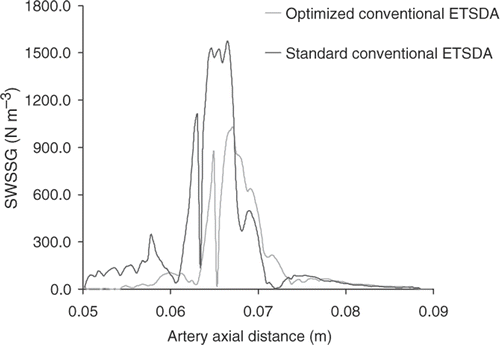
Figure 20. The generatrix of the Miller cuff ETSDA model.
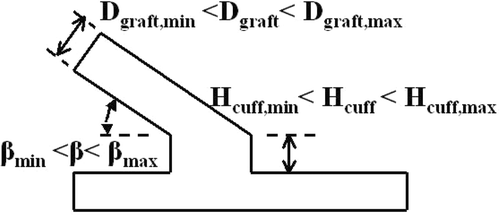
Figure 21. The objective function drop for all the Miller cuff ETSDA model cases.
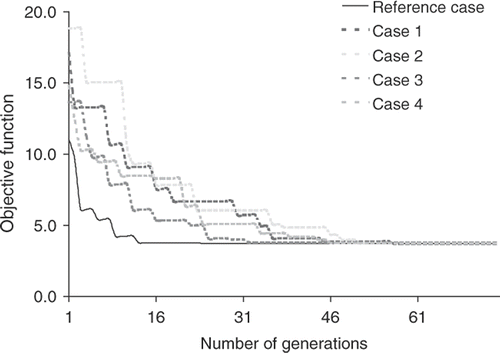
Figure 22. SWSSG plots for the standard and optimized Miller cuff ETSDA models.
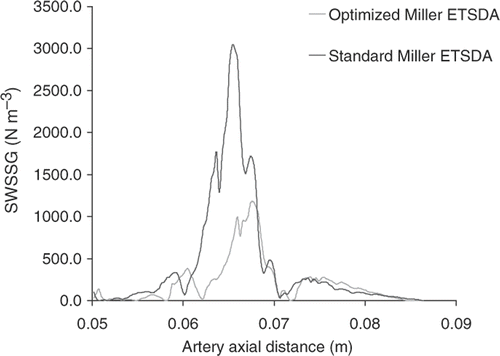
Figure 23. The generatrix of the hood ETSDA model.
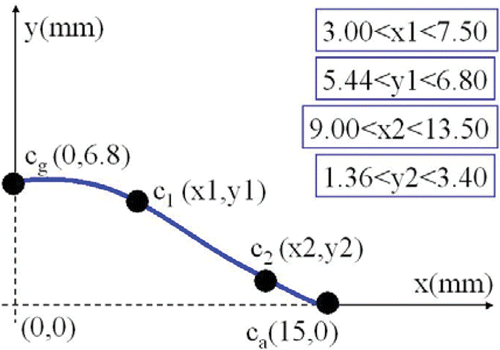
Figure 24. The objective function minimization for all the hood ETSDA cases.
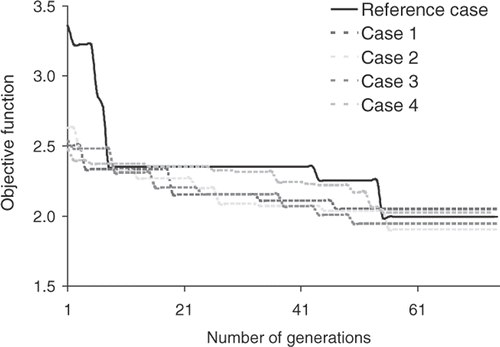
Figure 25. The optimized hood shapes for the reference and the four supportive cases.
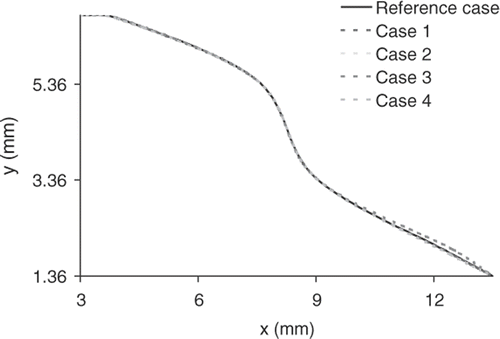
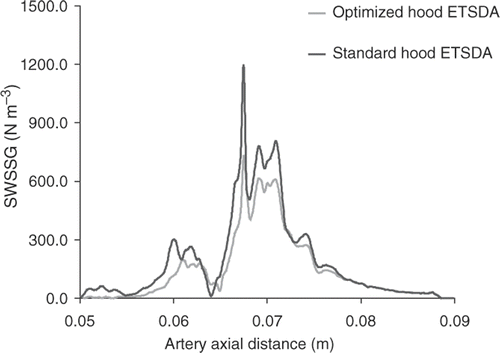
Figure 26. SWSSG plots for the standard and the optimized reference hood ETSDA models.