Figures & data
Figure 1. Profile of gravity water dam. The location of the damaged zone is indicated with the boundaries labelled accordingly. The height of the modelled dam is about 29 m, the crest has a length of 166 m and the radius of curvature is about 120 m.
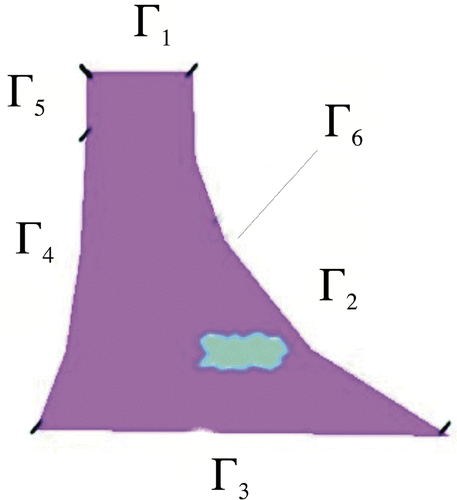
Figure 2. Solution of the forward problem: The first picture shows the distribution of the pore pressure for a fixed time t. The second and third pictures plot the mechanical displacement in the horizontal and vertical direction, respectively.
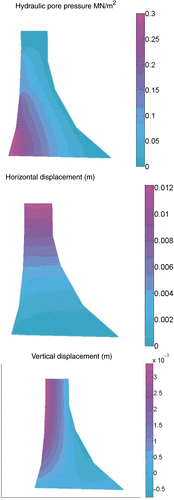
Figure 3. (a) Initial guess (homogeneous material distribution). (b) True solution, i.e. the location of the damage.
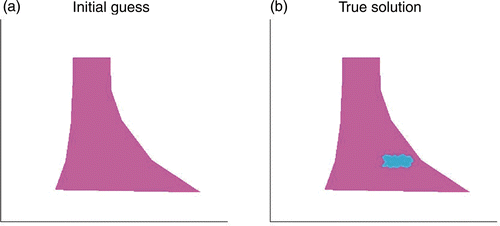
Figure 4. Reconstruction results where both E(x) (a) and k(x) (b) have been updated independently by the iteration in (16).
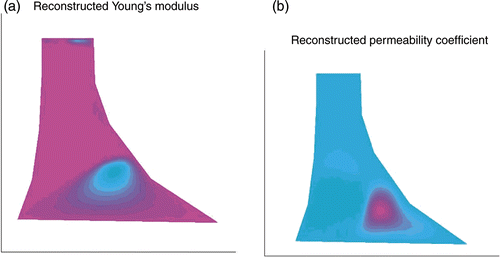
Figure 5. Reconstruction results. (a) Distribution of parameter χ(x) according to (45). (b) Sharpened solution.
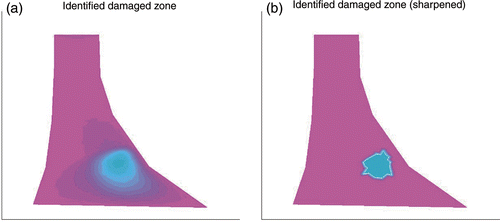
Figure 6. Location and identification, i.e. the distribution of the parameter χ(x) according to (45), of a crack close to the dam's tip.
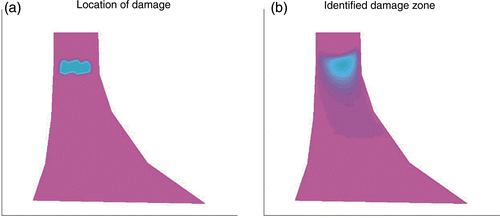
Figure 7. (a) Error eE(δ) ≔ ‖E† − En*(δ,yδ),δ‖ over increasing data noise δ. (b) Error ek(δ) ≔ ‖k† − kn*(δ,yδ),δ‖ over increasing data noise δ.
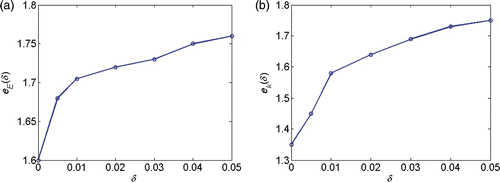
Figure 8. (a) Number of iterations n*(δ, yδ) for different noise levels δ. (b) Residual res(δ) = ‖F(pn,δ) − yδ‖ over δ.
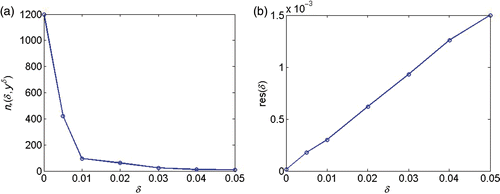
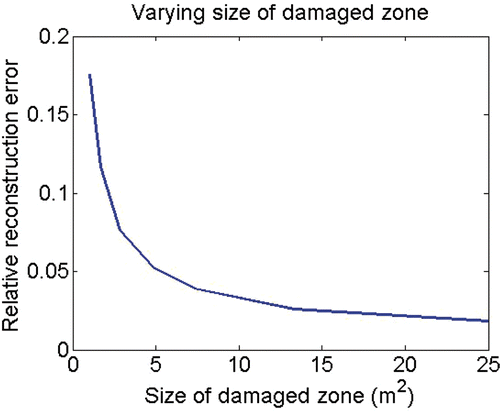
Figure 9. Relative reconstruction error over size of the damaged zone.