Figures & data
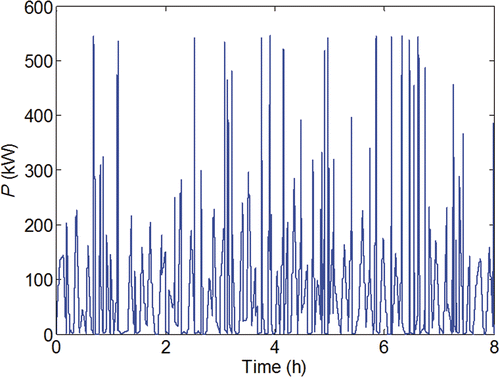
Figure 1. Elementary patterns for the signal representation: (a) segment, (b) sine and (c) cardinal sine.
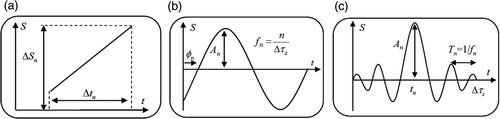
Figure 2. Individual genotype according to the chromosome encoding strategy: (a) with fixed (n) and (b) variable (n ∈ [1, npmax]) number of patterns.
![Figure 2. Individual genotype according to the chromosome encoding strategy: (a) with fixed (n) and (b) variable (n ∈ [1, npmax]) number of patterns.](/cms/asset/795540ab-c0a2-41f2-83d5-2a6aa071d637/gipe_a_624619_f0002.gif)
Figure 3. Typical architecture of hybrid locomotive with storage and associated energy management strategy.
Figure 4. Typical power profile with corresponding pdf and CDF: (a) load profile Pload(t), (b) pdf(Pload(t)) and (c) CDF(Pload(t)).
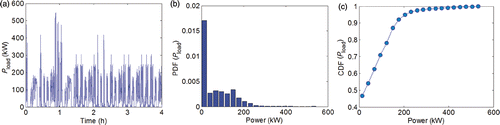
Figure 5. Typical BB 63 000 railway driving mission profile.
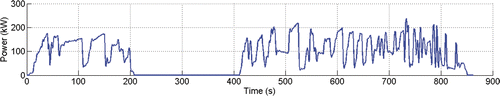
Figure 6. Evolution of mean error for each EA and signal model – best run plots: (a) segment model – 75 patterns, (b) sine model – 75 patterns and (c) cardinal sine model – 50 patterns.
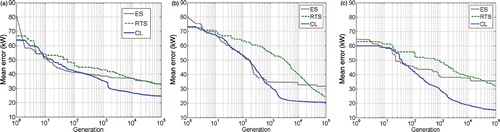
Figure 7. Comparison of the reference driving profile with the CL generated profile obtained by minimizing the mean error: (a) segment model – 75 patterns, (b) sine model – 75 patterns and (c) cardinal sine model – 50 patterns.
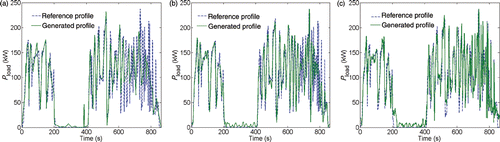
Figure 8. Identification of the reference driving profile by CL in association with a chromosome encodingstrategy allowing the variation of the number of patterns in the signal: (a) evolution of the mean error versus generations and (b) evolution of the number of patterns versus generations.
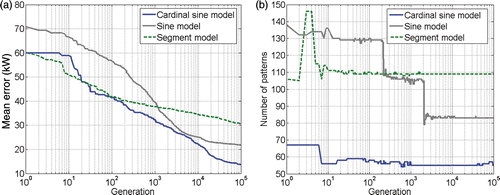
Figure 9. Set of seven real driving profiles of the BB 63 000 railway locomotive.
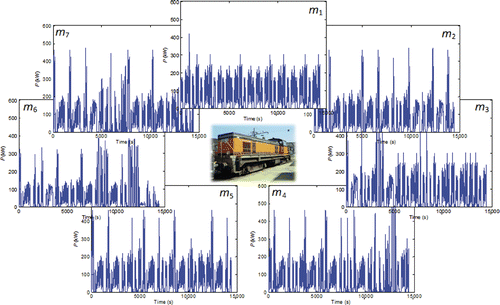
Table 1. Set of seven driving profiles characterized with the sizing and performance criteria.
Table 2. Sizing and performance criteria relative to an equivalent profile representative of the set of seven profiles.
Figure 10. ‘Fictitious’ driving profile generated by CL from 263 elementary segments with equivalent characteristics of the whole set of profiles.