238
Views
0
CrossRef citations to date
0
Altmetric
Special Section

A coupled soil moisture initialization scheme for the FSU/COAPS climate model

, &
Pages 420-437 | Received 17 Jun 2012, Accepted 19 Jun 2012, Published online: 15 Aug 2012

Figures & data

Figure 1. Comparison of observed TRMM rain rate (left panel) and assimilated rain rate (right panel) for the month of November 2004. Shown are averaged daily precipitation in mm day−1.

Figure 1. Comparison of observed TRMM rain rate (left panel) and assimilated rain rate (right panel) for the month of November 2004. Shown are averaged daily precipitation in mm day−1.

Figure 2. The 6 h accumulation of precipitation for November 2004 (15 UTC) for TRMM (upper left), PAR (upper right) and NCEP R2 (lower panel). Units are in mm/6 h.
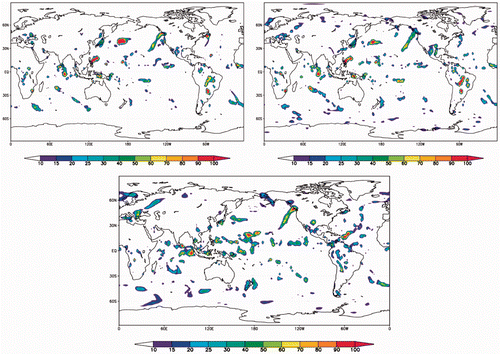
Figure 2. The 6 h accumulation of precipitation for November 2004 (15 UTC) for TRMM (upper left), PAR (upper right) and NCEP R2 (lower panel). Units are in mm/6 h.

Figure 3. Area-averaged precipitation for the Eastern Pacific ITCZ (170 W to 120 W, 5 S to 5 N) for the month of November 2004. Solid black lines are TRMM observations, green dash–dotted lines are from NCEP R2 and red fine dotted lines are from PAR. Units are 6 h accumulations in mm.
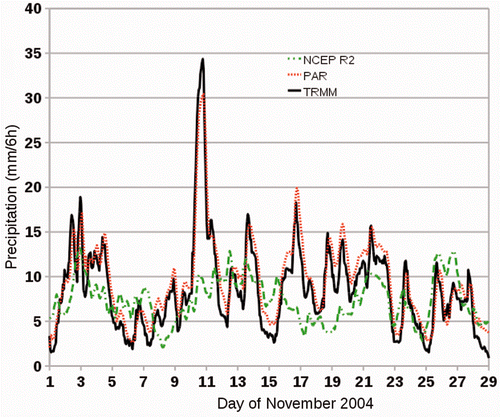
Figure 3. Area-averaged precipitation for the Eastern Pacific ITCZ (170 W to 120 W, 5 S to 5 N) for the month of November 2004. Solid black lines are TRMM observations, green dash–dotted lines are from NCEP R2 and red fine dotted lines are from PAR. Units are 6 h accumulations in mm.

Figure 4. (a) Soil moisture (m3 m−3) and (b) precipitation (mm) for Oklahoma. Black lines are from observations (Oklahoma Mesonet and GPCC), fine dotted lines are from PAR and dash–dotted lines are from the control experiments.
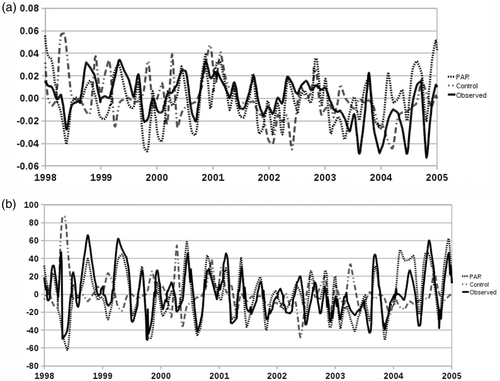
Figure 4. (a) Soil moisture (m3 m−3) and (b) precipitation (mm) for Oklahoma. Black lines are from observations (Oklahoma Mesonet and GPCC), fine dotted lines are from PAR and dash–dotted lines are from the control experiments.

Figure 5. Monthly soil moisture climatology profile from observations (top panel), PAR (middle panel) and Control experiment (lower panel). Soil moisture units are m3 m−3 and depth is in cm.
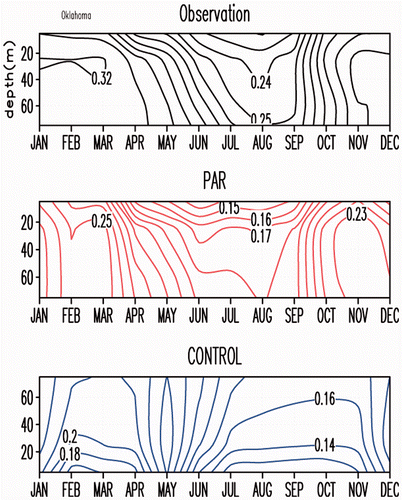
Figure 5. Monthly soil moisture climatology profile from observations (top panel), PAR (middle panel) and Control experiment (lower panel). Soil moisture units are m3 m−3 and depth is in cm.

Figure 6. Soil moisture anomaly at four layer depths for Oklahoma. Observations are black lines, PAR fine dotted lines and Control dash–dotted lines. Units are in m3 m−3. Vertical grid spacing is 0.1 for the top layer and 0.05 for the bottom three layers. Bold horizontal lines are zero.
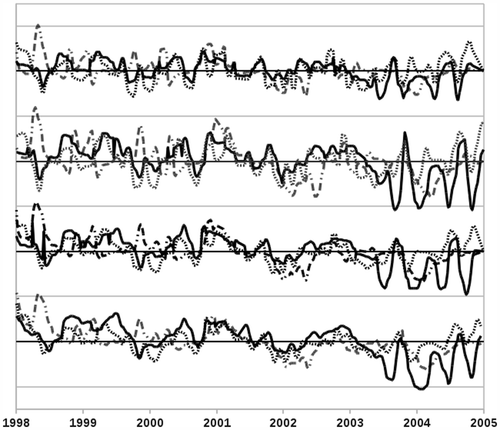
Figure 6. Soil moisture anomaly at four layer depths for Oklahoma. Observations are black lines, PAR fine dotted lines and Control dash–dotted lines. Units are in m3 m−3. Vertical grid spacing is 0.1 for the top layer and 0.05 for the bottom three layers. Bold horizontal lines are zero.

Figure 7. Net short-wave radiation flux anomaly (W m−2) for Oklahoma. Observation is the black line, PAR is the fine dotted line and Control is the dash–dotted line.
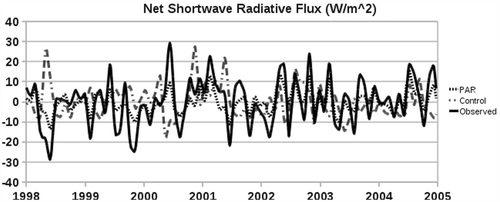
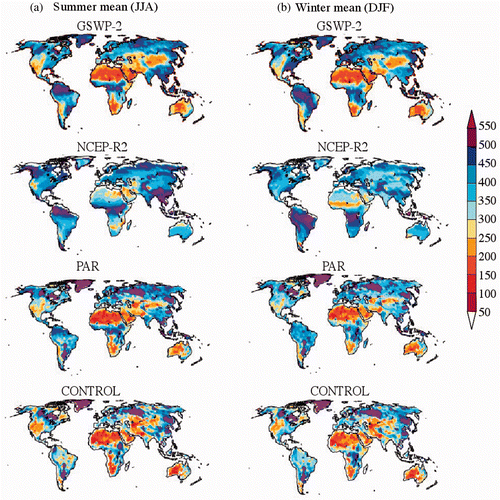
Figure 7. Net short-wave radiation flux anomaly (W m−2) for Oklahoma. Observation is the black line, PAR is the fine dotted line and Control is the dash–dotted line.
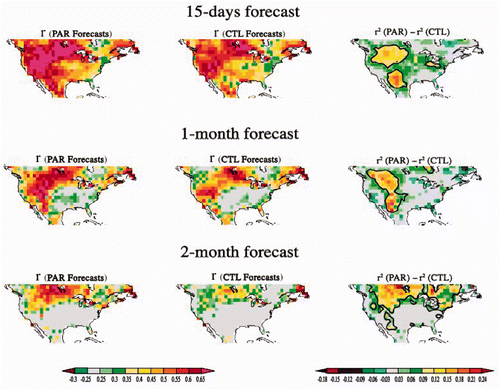
Figure 8. Average soil moisture content from 1986 to 1995 for: (a) boreal summer and (b) boreal winter months for top 1.5 m depth. Units are in mm.

Figure 8. Average soil moisture content from 1986 to 1995 for: (a) boreal summer and (b) boreal winter months for top 1.5 m depth. Units are in mm.

Figure 9. Forecast skill as measured by anomaly correlation for PAR (left panel), Control (middle panel) and difference in explained variance between PAR and Control (right panel).

Figure 9. Forecast skill as measured by anomaly correlation for PAR (left panel), Control (middle panel) and difference in explained variance between PAR and Control (right panel).

Reprints and Corporate Permissions

Please note: Selecting permissions does not provide access to the full text of the article, please see our help page How do I view content?

To request a reprint or corporate permissions for this article, please click on the relevant link below:

Academic Permissions

Please note: Selecting permissions does not provide access to the full text of the article, please see our help page How do I view content?

Obtain permissions instantly via Rightslink by clicking on the button below:

If you are unable to obtain permissions via Rightslink, please complete and submit this Permissions form. For more information, please visit our Permissions help page.