262
Views
2
CrossRef citations to date
0
Altmetric
Articles

Reconstruction of the complex refractive index in nonlinear phase contrast tomography

Pages 901-912 | Received 29 Jan 2014, Accepted 19 Jul 2014, Published online: 21 Aug 2014

Figures & data

Figure 1. Experimental set-up in propagation-based phase contrast tomography from a single propagation-based phase contrast image per projection showing the coordinate system.
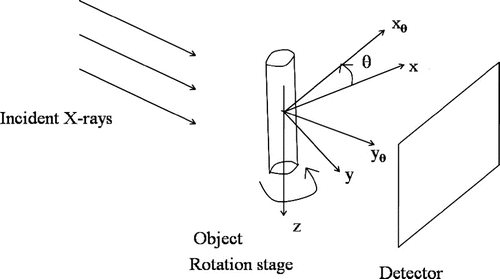
Figure 1. Experimental set-up in propagation-based phase contrast tomography from a single propagation-based phase contrast image per projection showing the coordinate system.

Table 1. Values of the δ and μ values for the materials in the object, for 24 keV X-rays, from http://henke.lbl.gov/optical_constants.

Figure 2. Horizontal section of the true β and δ maps.

Figure 2. Horizontal section of the true β and δ maps.

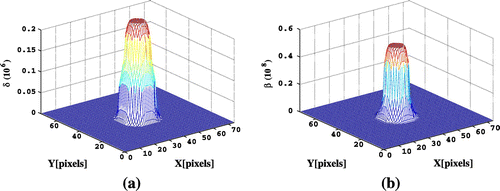
Figure 3. Horizontal section of the initial blurred β and δ maps.

Figure 3. Horizontal section of the initial blurred β and δ maps.

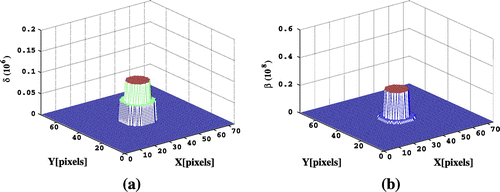
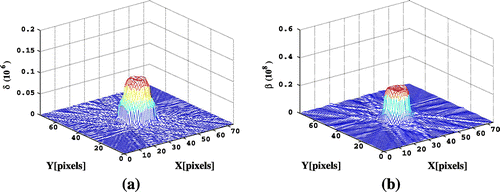
Figure 4. Section of the reconstructed β and δ maps for a PPSNR of 24 dB.

Figure 4. Section of the reconstructed β and δ maps for a PPSNR of 24 dB.

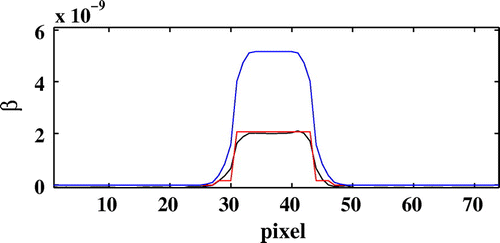
Figure 5. Diagonal profiles of the β map:intial map (blue), true map (red), reconstructed map (Black) (PPSNR = 24 dB).

Figure 5. Diagonal profiles of the β map:intial map (blue), true map (red), reconstructed map (Black) (PPSNR = 24 dB).

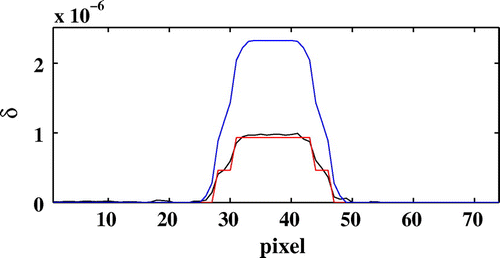
Figure 6. Diagonal profiles of the δ map:intial map (blue), true map (red), reconstructed map (black) (PPSNR = 24 dB).

Figure 6. Diagonal profiles of the δ map:intial map (blue), true map (red), reconstructed map (black) (PPSNR = 24 dB).

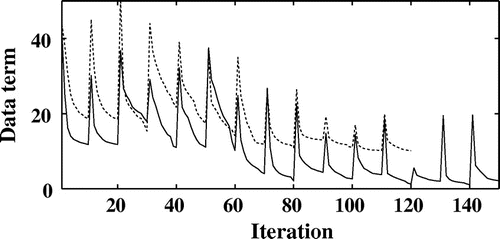
Figure 7. Evolution of the partial data term corresponding to the selected projection angle as a function of the iterations number without noise (full line) and with noise (dotted line) for a PPSNR=24 dB.

Figure 7. Evolution of the partial data term corresponding to the selected projection angle as a function of the iterations number without noise (full line) and with noise (dotted line) for a PPSNR=24 dB.

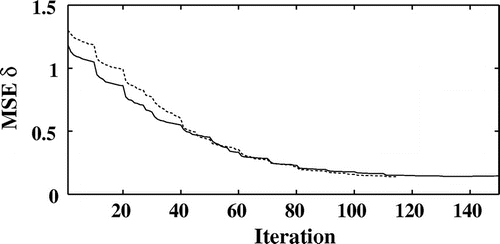
Figure 8. Evolution of the normalized mean square error on δ as a function of the iterations number without noise (full line) and with noise (dotted line) for a PPSNR = 24 dB.

Figure 8. Evolution of the normalized mean square error on δ as a function of the iterations number without noise (full line) and with noise (dotted line) for a PPSNR = 24 dB.

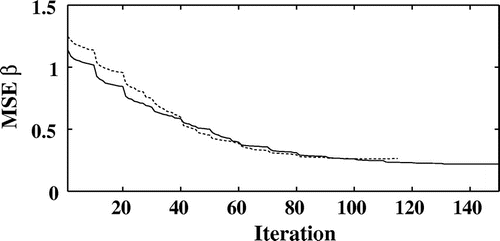
Figure 9. Evolution of the normalized mean square error on β as a function of the iterations number without noise (full line) and with noise (dotted line) for a PPSNR = 24 dB.

Figure 9. Evolution of the normalized mean square error on β as a function of the iterations number without noise (full line) and with noise (dotted line) for a PPSNR = 24 dB.

Reprints and Corporate Permissions

Please note: Selecting permissions does not provide access to the full text of the article, please see our help page How do I view content?

To request a reprint or corporate permissions for this article, please click on the relevant link below:

Academic Permissions

Please note: Selecting permissions does not provide access to the full text of the article, please see our help page How do I view content?

Obtain permissions instantly via Rightslink by clicking on the button below:

If you are unable to obtain permissions via Rightslink, please complete and submit this Permissions form. For more information, please visit our Permissions help page.