Figures & data
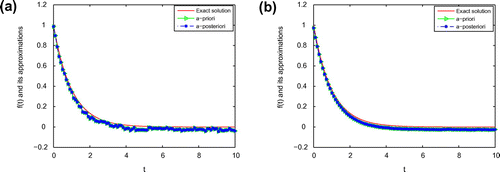
Figure 1. The comparison of the numerical effects between the exact solution and its computed approximations for ,
with Example 1: (a)
, (b)
.
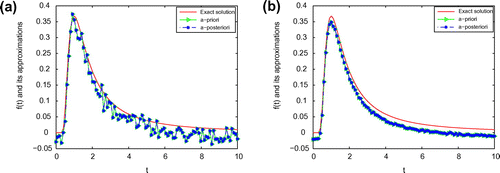
Figure 2. The comparison of the numerical effects between the exact solution and its computed approximations for ,
with Example 1: (a)
, (b)
.
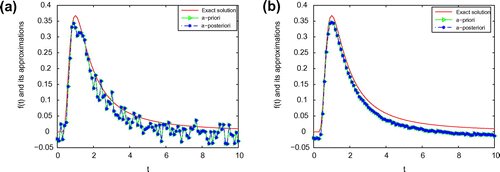
Figure 3. The comparison of the numerical effects between the exact solution and its computed approximations for ,
with Example 1: (a)
, (b)
.
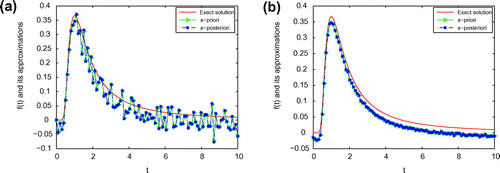
Figure 4. The comparison of the numerical effects between the exact solution and its computed approximations for ,
with Example 2: (a)
, (b)
.
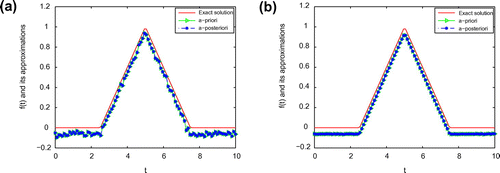
Figure 5. The comparison of the numerical effects between the exact solution and its computed approximations for ,
with Example 2: (a)
, (b)
.
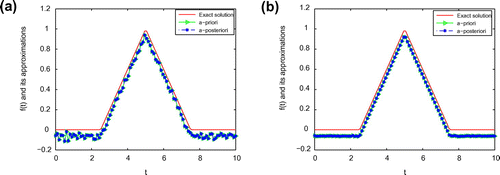
Figure 6. The comparison of the numerical effects between the exact solution and its computed approximations for ,
with Example 2: (a)
, (b)
.
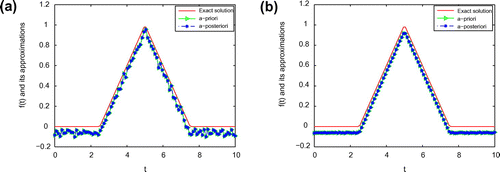
Figure 7. The comparison of the numerical effects between the exact solution and its computed approximations for ,
with Example 3: (a)
, (b)
.
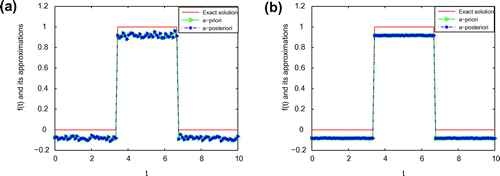
Figure 8. The comparison of the numerical effects between the exact solution and its computed approximations for ,
with Example 3: (a)
, (b)
.
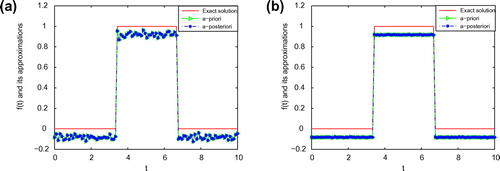
Figure 9. The comparison of the numerical effects between the exact solution and its computed approximations for ,
with Example 3: (a)
, (b)
.
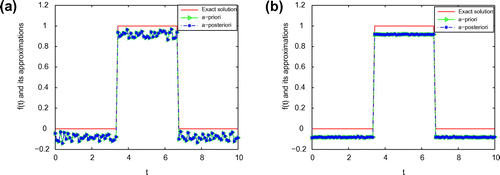
Figure 10. The comparison of the numerical effects between the exact solution and its computed approximations for ,
with Example 4: (a)
, (b)
.
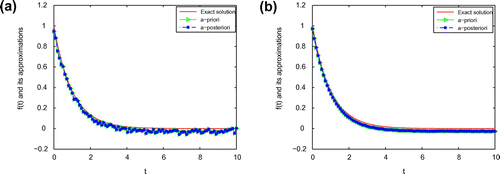
Figure 11. The comparison of the numerical effects between the exact solution and its computed approximations for ,
with Example 4: (a)
, (b)
.
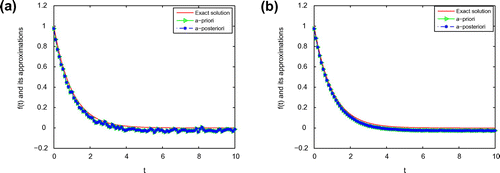
Figure 12. The comparison of the numerical effects between the exact solution and its computed approximations for ,
with Example 4: (a)
, (b)
.