
Figures & data
Figure 1. Graph of and
with various values of polynomials
and scattered points
for Example 1.
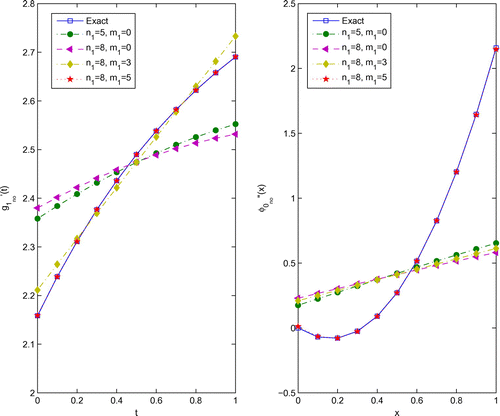
Figure 2. Graph of and
and absolute errors
and
for Example 1.
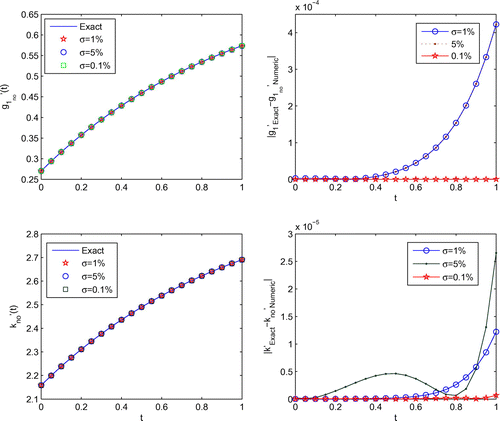
Figure 3. Graph of and
and absolute errors
and
for Example 2.
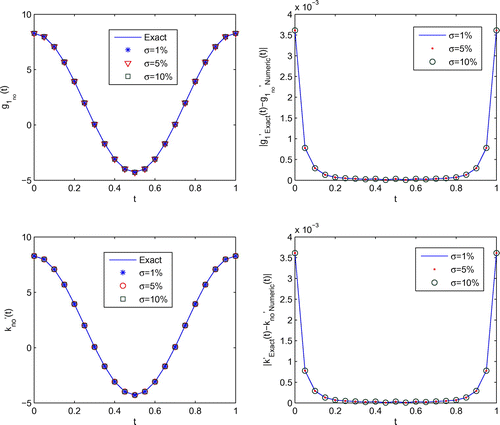
Figure 4. Graph of and
and absolute errors
and
for Example 1.
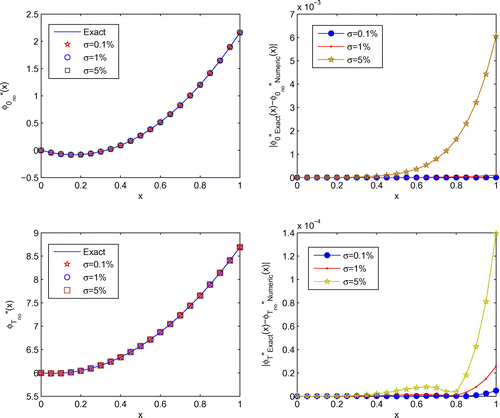
Figure 5. Graph of and
and absolute errors
and
for Example 2.
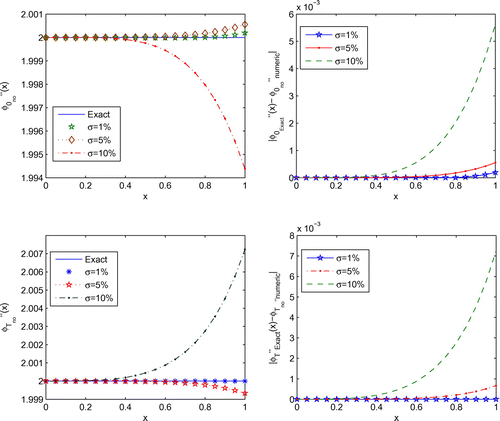
Figure 6. Graph of f(t) and absolute error with noiseless and noisy data when
and
for Example 1.
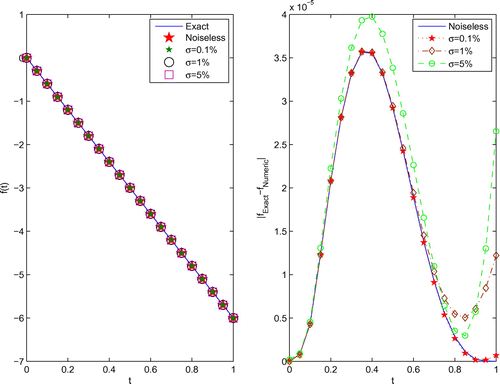
Figure 7. Graph of and absolute error
with noiseless and noisy data when
and
for Example 1.
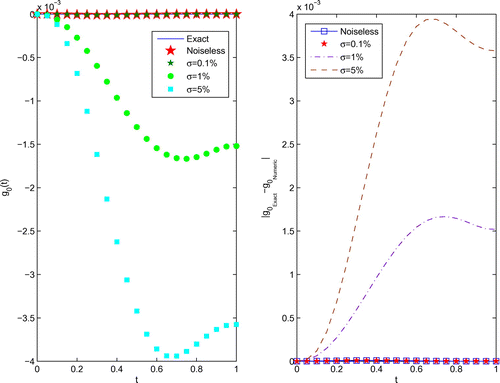
Figure 8. Graph of h(t) and absolute error with noiseless and noisy data when
and
for Example 1.
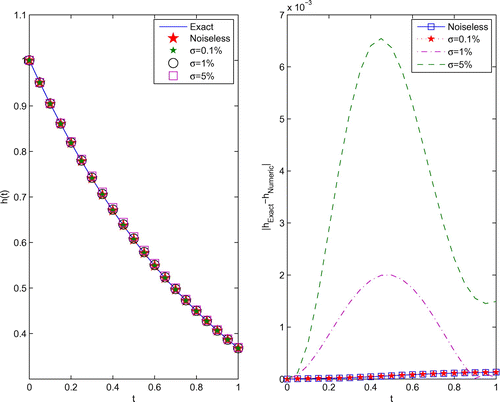
Figure 9. Graph of and RES(f), RES(h) with noiseless data when
and various values of
for Example 1.
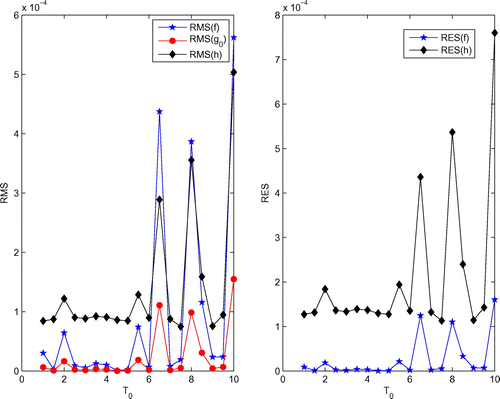
Figure 10. Graph of f(t) with noiseless and noisy data when and
for Example 2.
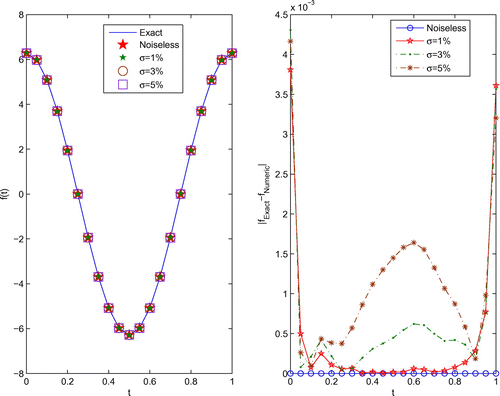
Figure 11. Graph of with noiseless and noisy data when
and
for Example 2.
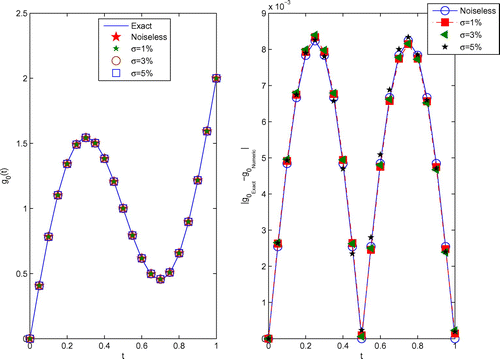
Figure 12. Graph of h(t) with noiseless and noisy data when and
for Example 2.
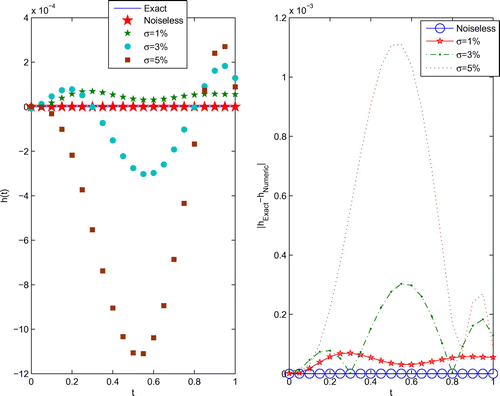
Figure 13. Graph of and RES(f), RES(h) with noiseless data when
and various values of
for Example 2.
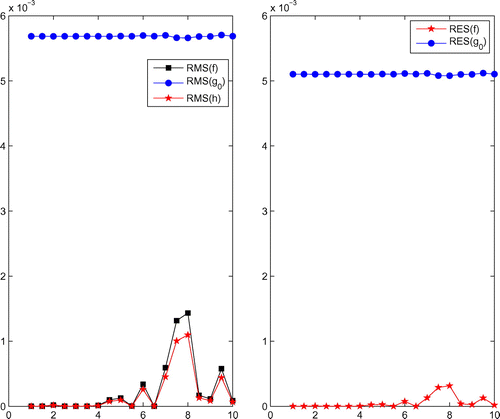
Table 1. The values of RMS(f), RES(f), ,
, RMS(h) and RES(h) with different choose of n and m when
and
for Example 1.
Table 2. The values of RMS(f), RES(f), ,
, RMS(h) and RES(h) with different choose of
when
and
for Example 1.
Table 3. The values of RMS(f) and RES(f) for various values of ,
,
and
for Example 1.
Table 4. The values of RES(f) for various values of and
when
and
for Example 1.
Table 5. The values of RMS(f), RES(f), ,
, RMS(h) and RES(h) with different choose of n and m when
and
for Example 2.
Table 6. The values of RMS(f), RES(f), ,
, RMS(h) and RES(h) with different choose of
when
and
for Example 2.
Table 7. The values of RES(f) for various values of and
when
and
for Example 2.