Figures & data
Figure 1. Flowchart of the optimization algorithm.
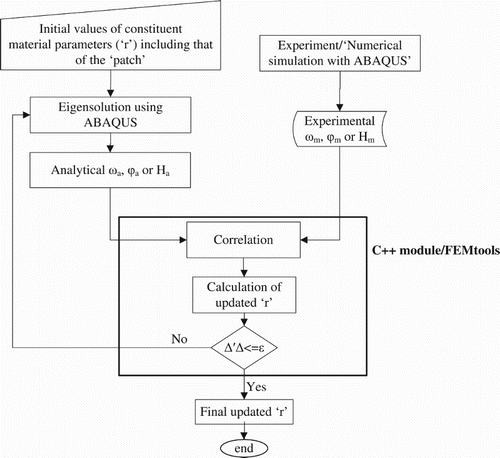
Table 1. Material properties for the test plate.
Table 2. First six natural frequencies of the ‘patch’ plate.
Table 3. Difference in frequencies of an example plate with and without the presence of a ‘patch’.
Figure 2. Convergence plots for (a) fibre, (b) matrix and (c) ‘patch’ moduli without noise in ‘test’ data.
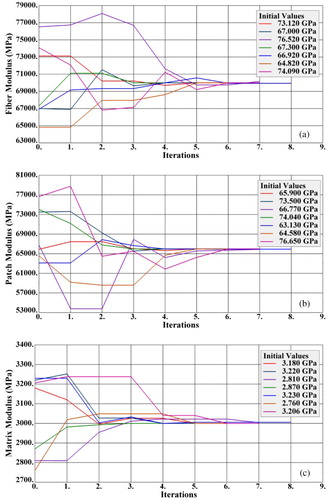
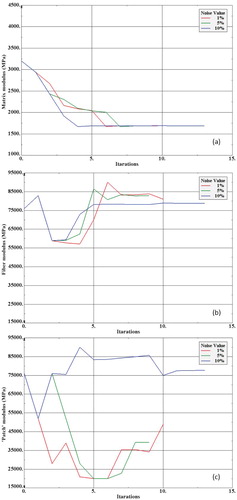
Figure 3. Convergence plots for (a) fibre, (b) matrix and (c) ‘patch’ moduli with noise in ‘test’ data.
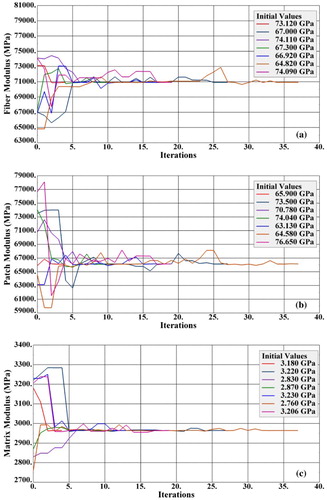
Figure 4. Convergence plots for (a) fibre, (b) matrix and (c) ‘patch’ moduli with a 20% sized patch and having noise in ‘test’ data.
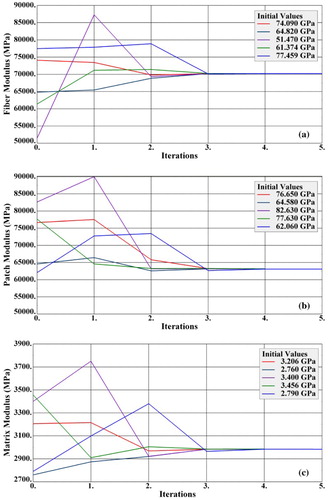
Figure 5. Convergence of ‘patch’ moduli with noise in ‘test’ data.
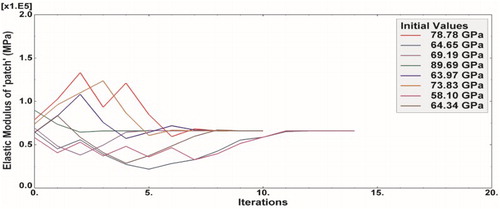
Figure 6. Convergence of the ‘patch’ modulus with noise in ‘test’ data using frequency and FRFs.
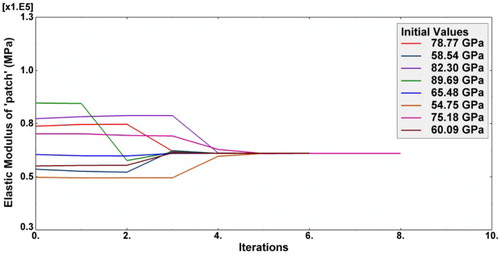
Figure 7. Dimensions of the test plate with a ‘patch’ having different elastic properties.
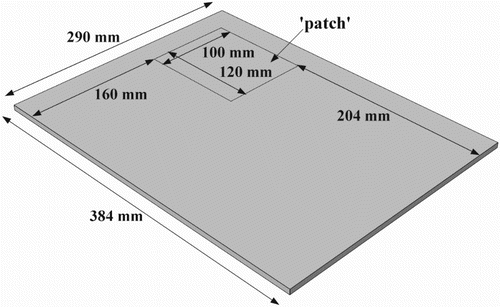
Table 4. Natural frequencies of the ‘patch’ plate and the reference plate.
Figure 8. Measured mode shapes of the ‘patch’ plate and the reference plate.
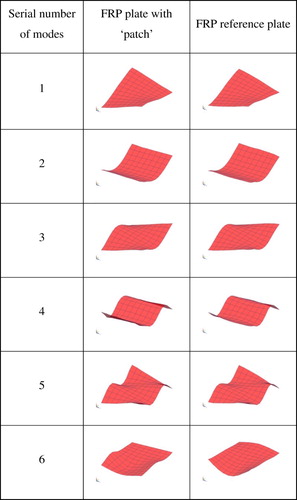
Figure 9. Comparison of mode 6 for the plates with and without ‘patch’.
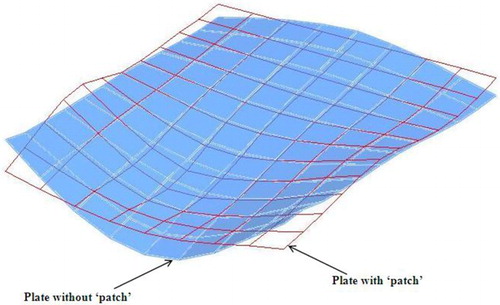
Figure 10. Computed FE mode shapes of the ‘patch plate’.
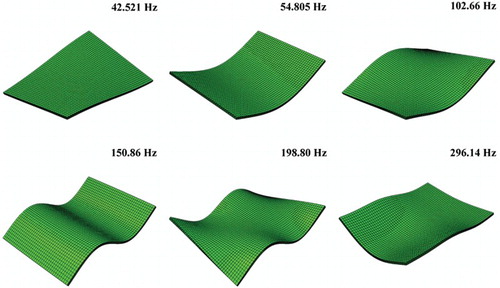
Figure 11. Convergence curves for the elastic modulus of (a) matrix (b) fibre outside the ‘patch’ and (c) fibre within the ‘patch’.