Figures & data
Figure 1. Initial geometry for the sensitivity experiments with an almost non-radiating single source.
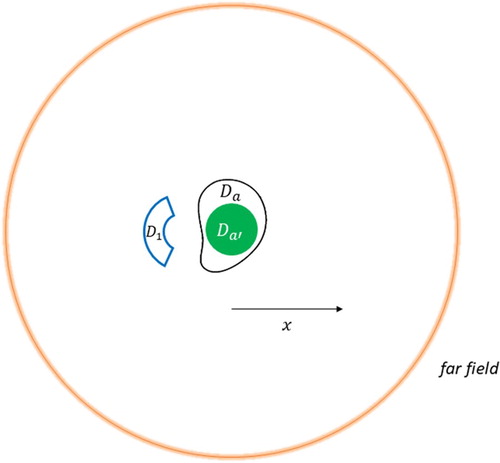
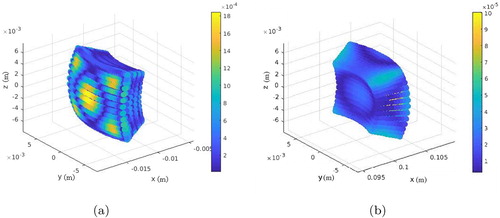
Figure 2. Different views of the surface field pattern on the actual source .
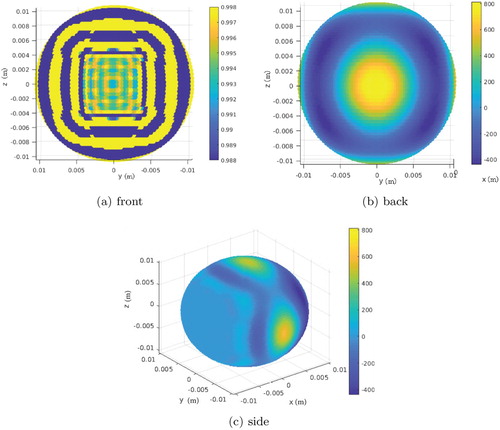
Figure 3. The near control region after an outward shift from the source.
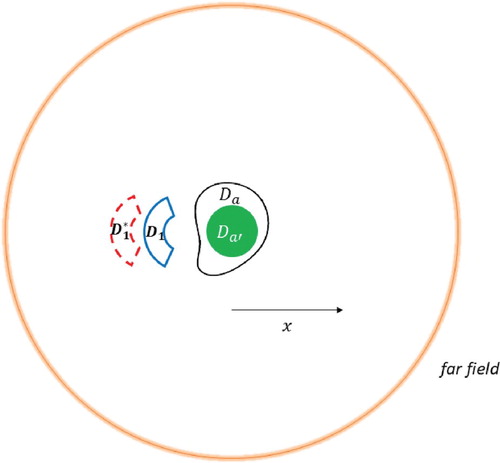
Figure 4. norm of the source density
as a function of the distance between
and
.
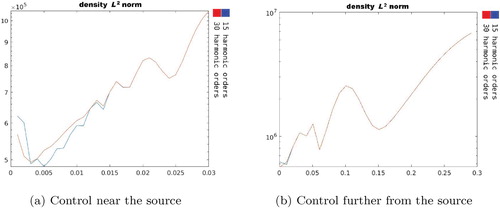
Figure 5. Relative supremum error in as a function of the distance between
and
.
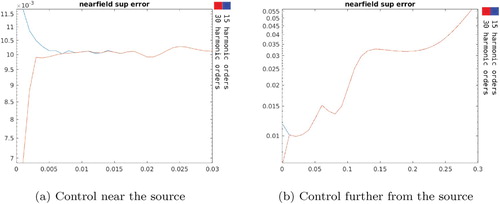
Figure 6. Absolute supremum error on as a function of the distance between
and
.
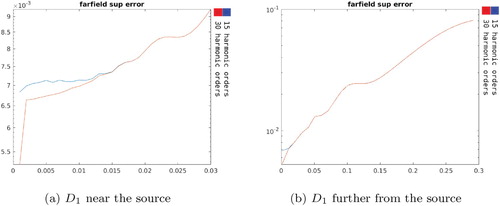
Figure 7. Stability of the scheme as a function of the distance between and
.

Figure 8. The initial near control and an iterate
after increasing the outer radius.
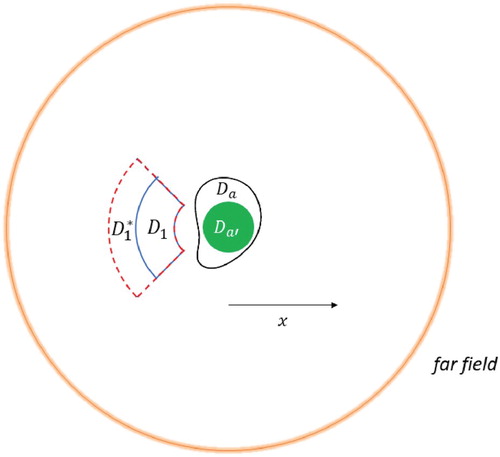
Figure 9. norm of the source density
as a function of the increments in
outer radius.
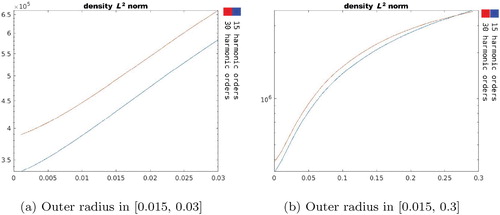
Figure 10. Relative supremum error in as a function of the increments in
outer radius.
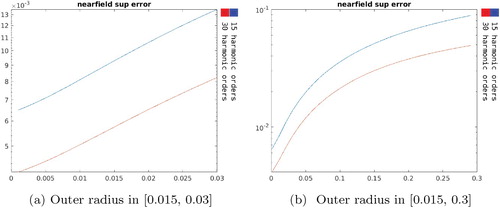
Figure 11. Absolute supremum error on as a function of the increments in
outer radius.
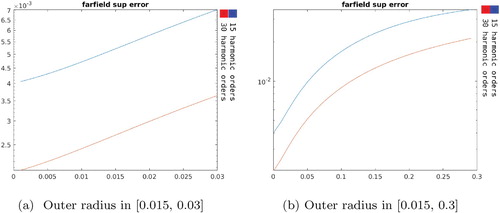
Figure 12. Stability measure as a function of the increments in outer radius.
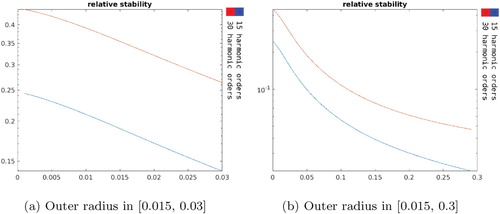
Figure 13. The initial near control and an iterate
after increasing both the inner and outer radii by equal increments.
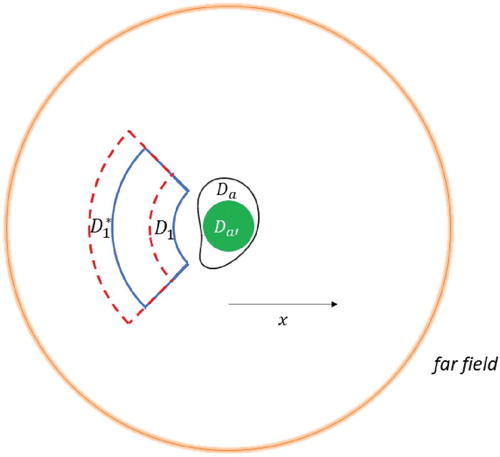
Figure 14. norm of the source density
as a function of the
radii increment.
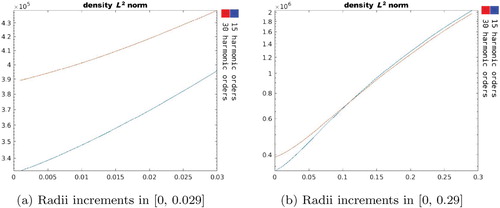
Figure 15. Relative supremum error as a function of radii increment.
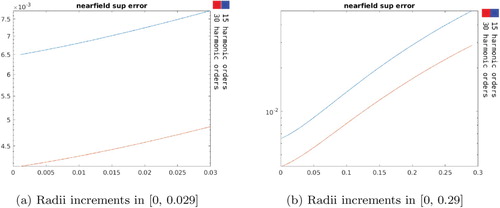
Figure 16. Absolute supremum error on as a function of
radii increment.
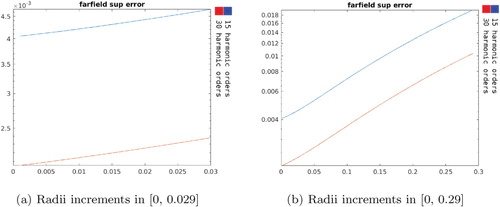
Figure 17. Stability measure as a function of radii increment.
Figure 18. The initial geometry for the multi-region controls.
Figure 19. Different views of the surface field pattern on .
Figure 20. Illustration of two iterations showing the secondary region rotated around .
Figure 21. norm of
as a function of the secondary region's angle of rotation.
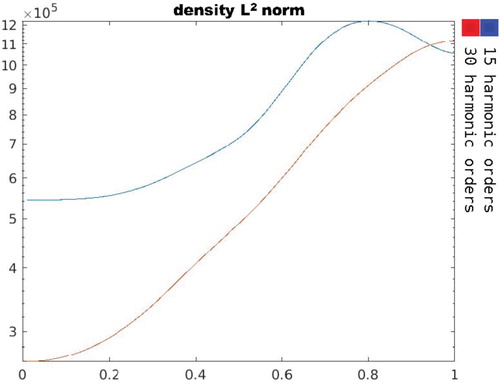
Figure 22. Accuracy errors in .
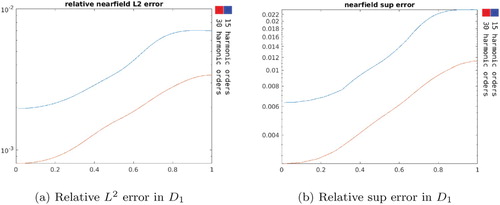
Figure 23. Supremum error in as a function of its angle of rotation.
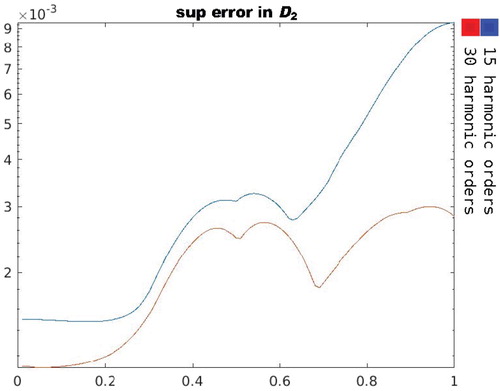
Figure 24. Stability measure as a function of the secondary region's angle of rotation.
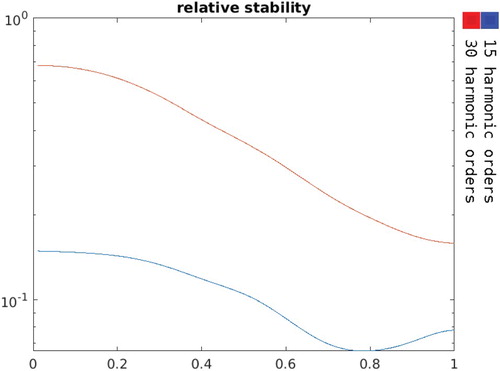
Figure 25. Sketch of the geometry where is acting as a near field obstacle to
.
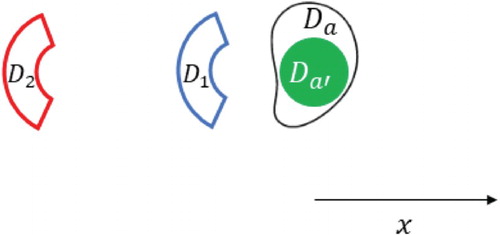
Figure 26. Performance of the scheme in generating a null in and a plane wave in
.
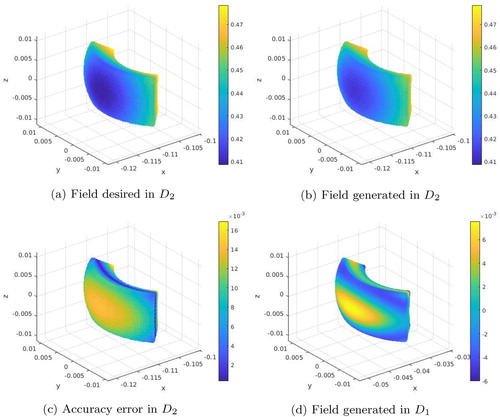
Figure 27. Different views of the surface field pattern on .
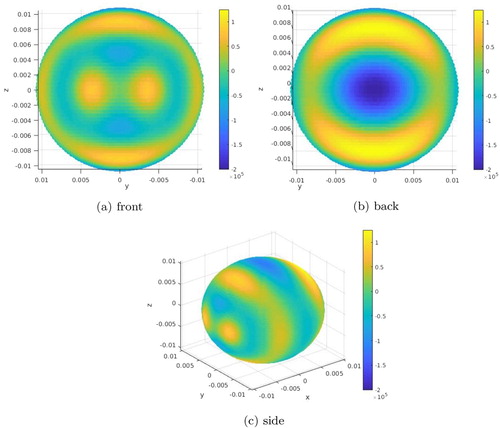
Figure 28. Time snapshots of a cross section of the near field at kct values (left-right, top-down) .
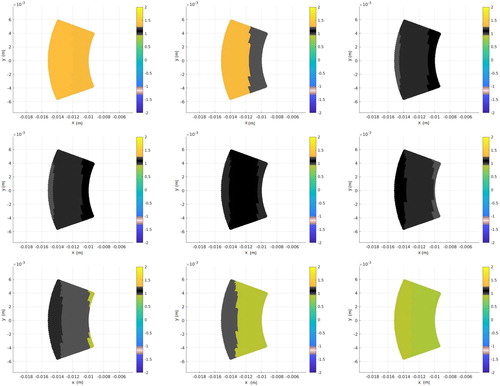
Figure 29. (a) Time-averaged relative error in region . (b) Time-averaged absolute error in region
over one period.