Figures & data
Table 1. The fundamental operations of the DTM.
Figure 1. Computational models of BEM and FEM. (a) BEM 1, (b) BEM 2, (c) BEM 3, (d) FEM.
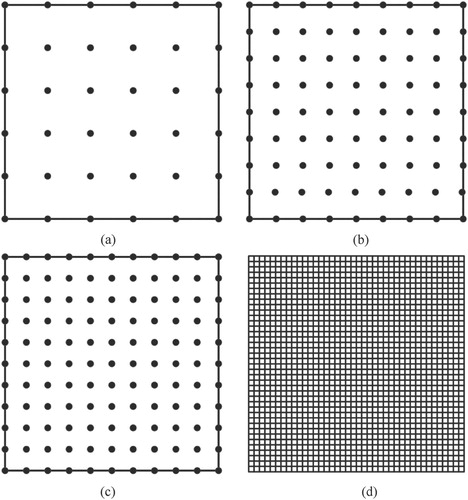
Table 2. The detailed boundary element models.
Figure 2. The temperature distribution for different computational models. (a) BEM 1, (b) BEM 2, (c) BEM 3, (d) FEM.
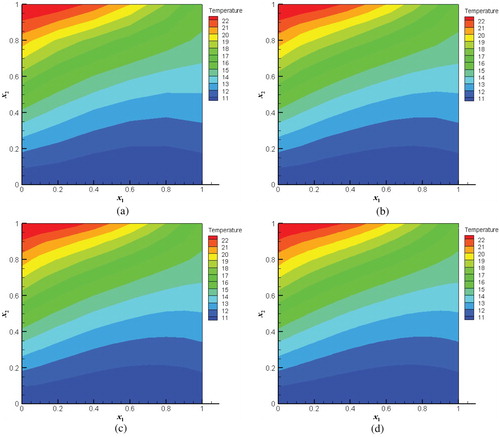
Table 3. The comparison of DT-DRBEM and FD-DRBEM.
Table 4. The comparison of the L-M and the CGM.
Figure 3. DRBEM computational model.
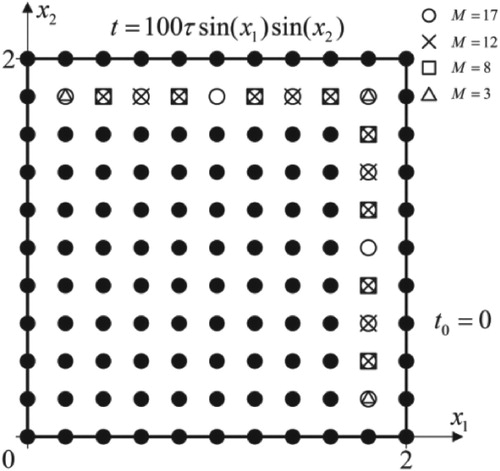
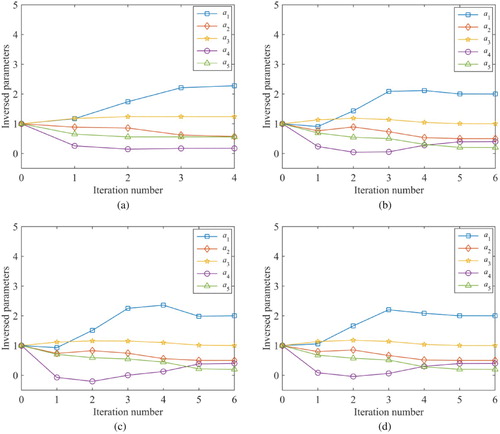
Figure 4. The results for different initial guesses. (a) , (b)
, (c)
, (d)
.
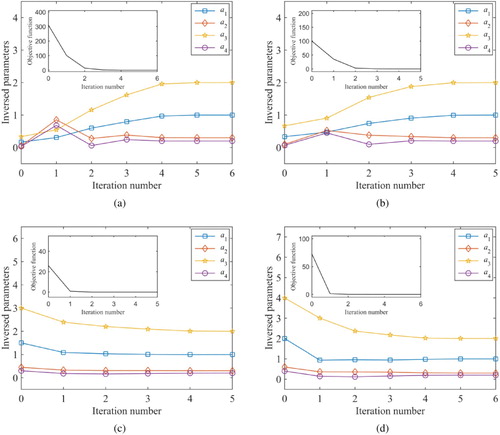
Table 5. The inverse results for different initial guesses.
Figure 5. The results for different number of measurement points. (a) 3 measurement points, (b) 8 measurement points, (c) 12 measurement points, (d) 17 measurement points.
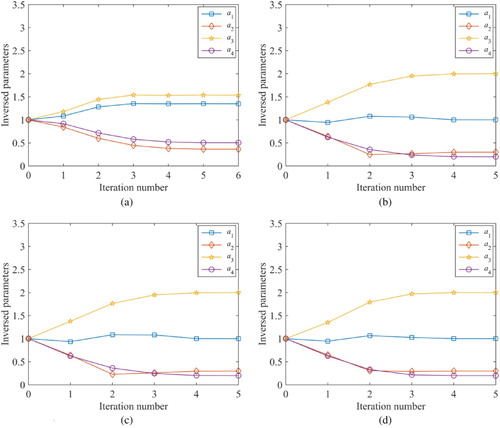
Table 6. The inverse results for different measurement points.
Table 7. The inverse results for different measurement errors.
Figure 6. DRBEM computational model.
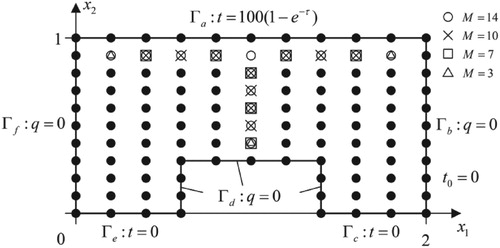
Figure 7. The results for different initial guesses. (a) , (b)
, (c)
, (d)
.
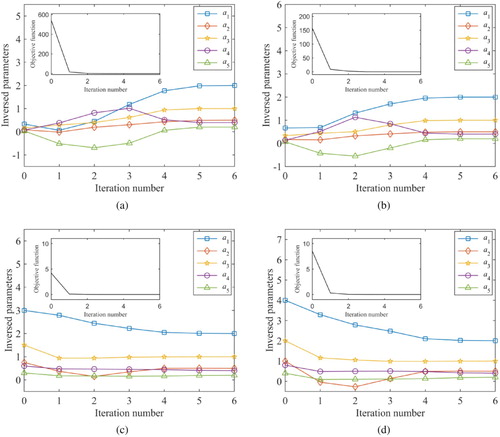
Table 8. The inverse results for different initial guesses.
Figure 8. The results for different number of measurement points. (a) 3 measurement points, (b) 7 measurement points, (c) 10 measurement points, (d) 14 measurement points.