Figures & data
Figure 1. Example of an heterogeneous domain including three geological zones and four wells.
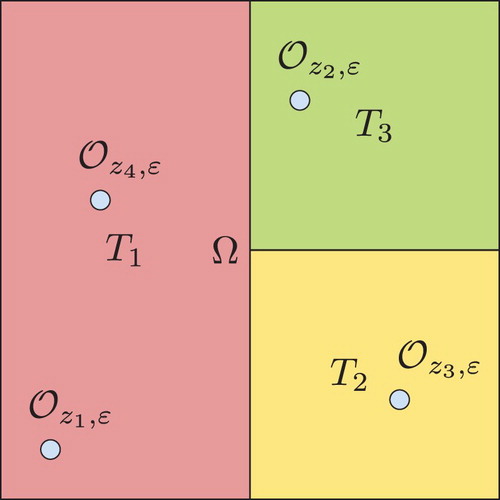
Table 1. Well's location and corresponding errors for different number of measurements (case of a well located at  ).
).
Table 2. Relative errors in the case of 2 wells separated by different distances.
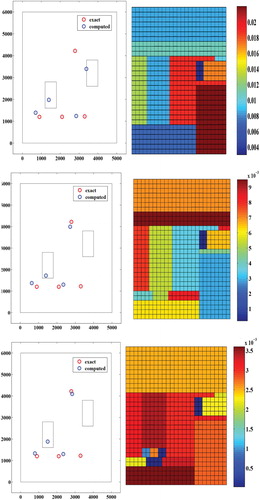
Figure 2. Wells' location with Algorithm 1 in the case of four wells. (a) Topological gradient distribution and (b) exact and recovered wells' position.
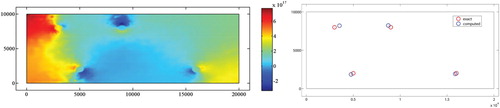
Table 3. Identified locations compared to exact ones in the case of four wells.
Figure 3. An example of parameterization refinement. (a) Computing mesh (b) Zonation associated to
and (c) Zonation associated to
.
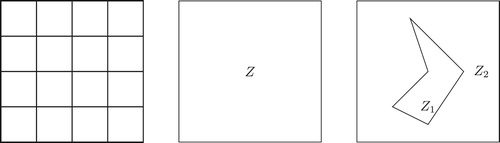
Figure 4. Geometry of the Rocky Mountain aquifer.
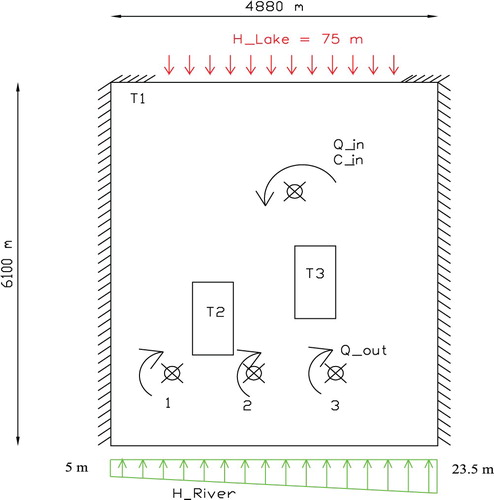
Figure 5. Wells' position and parameterization at iterations 1, 3 and 6 with full data.
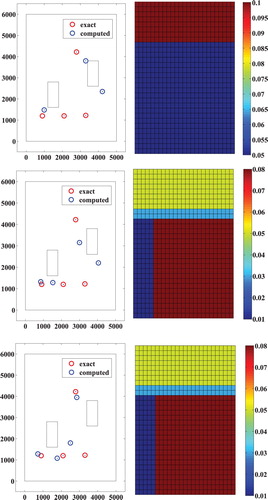
Figure 6. Wells' position and parameterization at iterations 12 and 15 with full data.
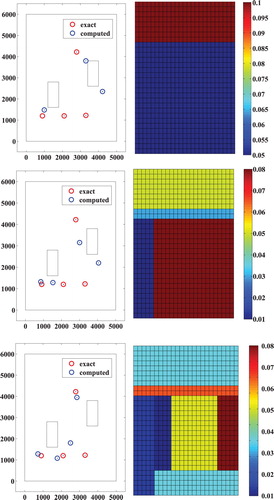
Figure 7. Decrease of the cost function during the iterations in the case of full data (Rocky Mountain example).
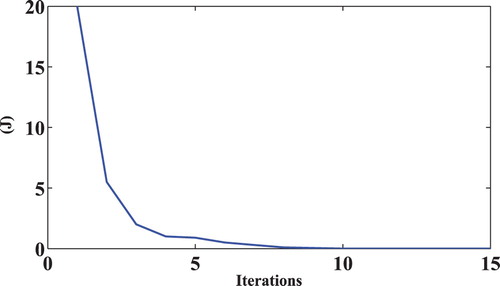
Figure 8. Wells' position and parameterization at iterations 1,3 and 6 with measurements.
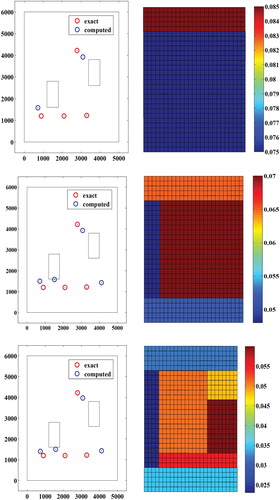
Figure 9. Wells' position and parameterization at iterations 12,15 and 19 with measurements.
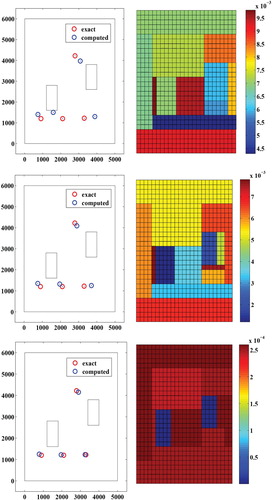
Table 4. Wells' computed locations and corresponding relative errors using full data (Rocky Mountain example).
Table 5. Wells' computed locations and corresponding relative errors using data (Rocky Mountain example).
Table 6. Transmissivities' values at different iterations: Rocky Mountain example with full data.
Table 7. Transmissivities' values at different iterations: Rocky Mountain example with data.
Table 8. Recovered transmissivities and corresponding relative errors with full and reduced data (Rocky Mountain example).
Figure 10. Wells' position and parameterization at iterations 12, 15 and 19 with noise on full data.
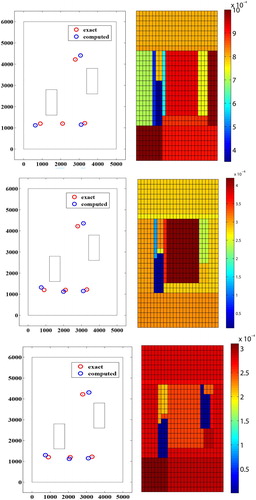
Figure 11. Wells' position and parameterization at iterations 12, 15 and 23 with noise on full data.
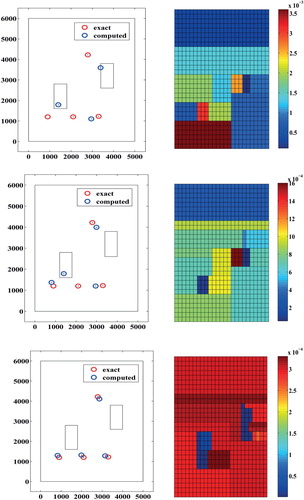
Figure 12. Wells' position and parameterization at iterations 12, 15 and 19 with noise on full data.