Figures & data
Table 1. Shear strength variation with water content in simulative soil samples.
Figure 1. Photograph of Anton-Paar MCR 301 Rheometer with bentonite-water mixture sample.
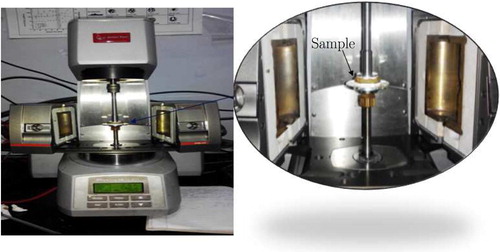
Figure 2. Parallel plate geometry: (a) torsional flow of the sample and (b) enlarged view of parallel plate disc with sandpaper.
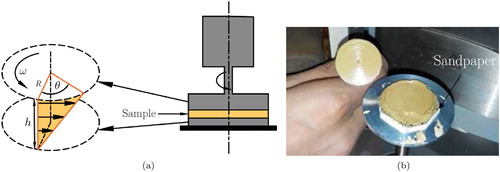
Figure 3. Evolution of torque with time in simulative soil samples at various shear rates: (a) sample with a shear strength of 1 kPa and (b) sample with a shear strength of 3 kPa.
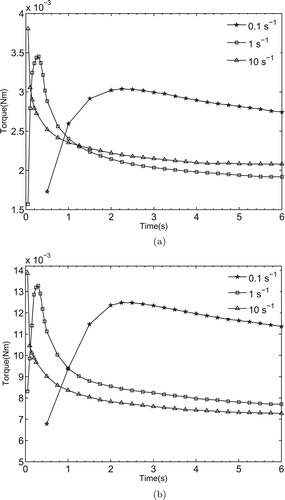
Figure 4. Schematic diagram illustrating the notion of current natural configuration of the material.
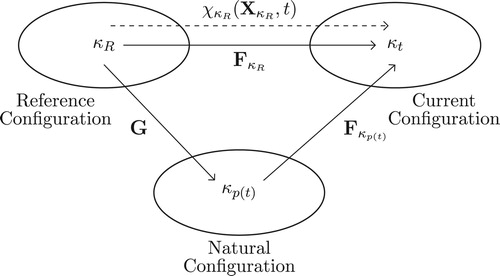
Figure 5. Geometry of the cylinder for the torsional flow under consideration.
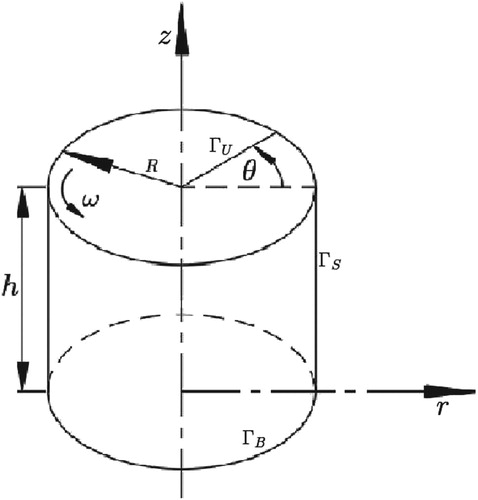
Figure 6. Flow diagram of solution methodology for the optimization of model parameters.
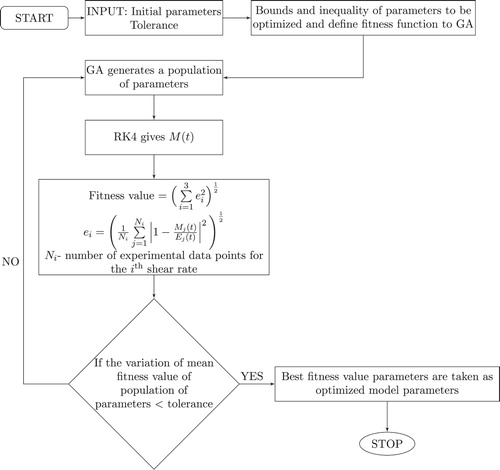
Table 2. Optimized values associated with the parameters of the model.
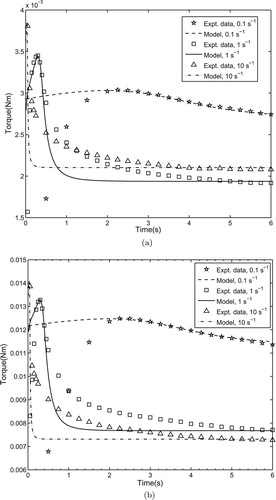
Figure 7. Comparison of the torque predicted by the model with that of the experimental data at various shear rates: (a) sample with shear strength of 1 kPa and (b) sample with shear strength of 3 kPa.