Figures & data
Figure 1. Sketch of heat flux inversion.
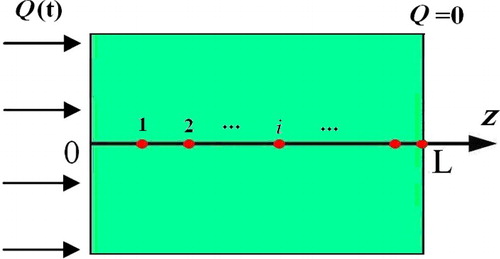
Figure 2. The heat flux estimated with Piecewise function.
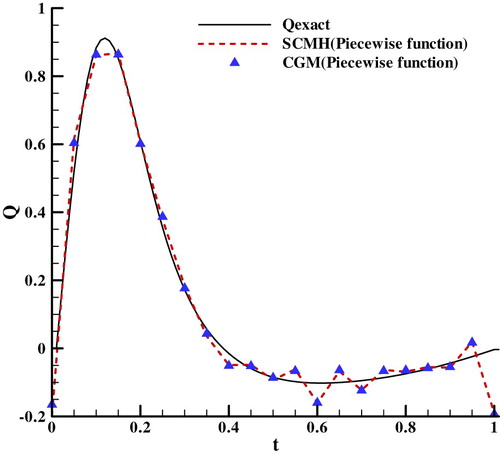
Figure 3. The heat flux estimated with Fourier series.
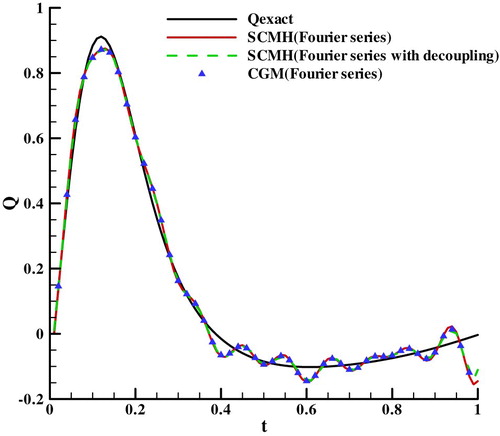
Figure 4. Fourier coefficients estimated by different methods.
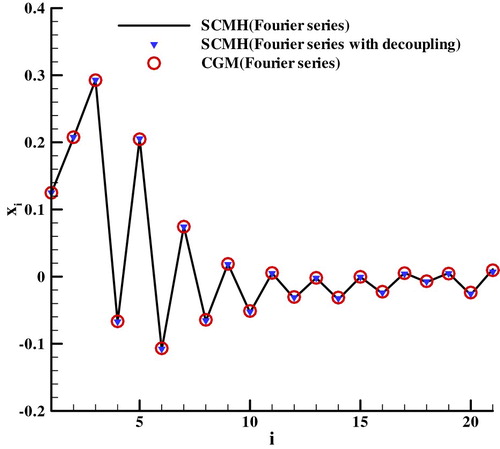
Figure 5. Convergence process of different methods.
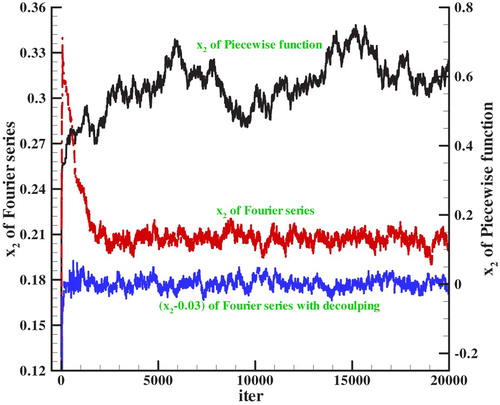
Figure 6. The triangle heat flux estimated with noises.
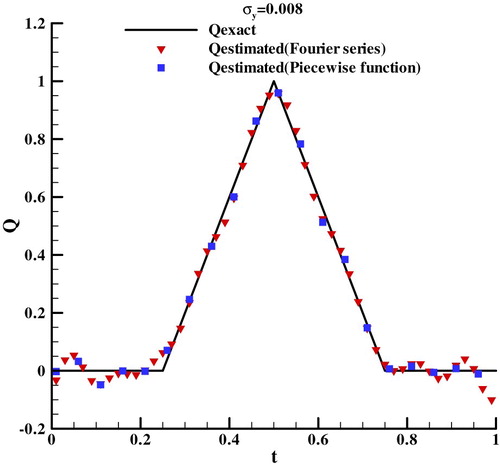
Figure 7. The variances of posterior distribution of heat flux.
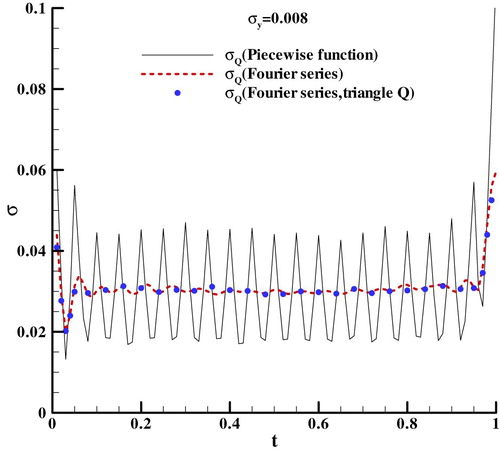
Figure 8. The variances of posterior distribution of Fourier coefficients.
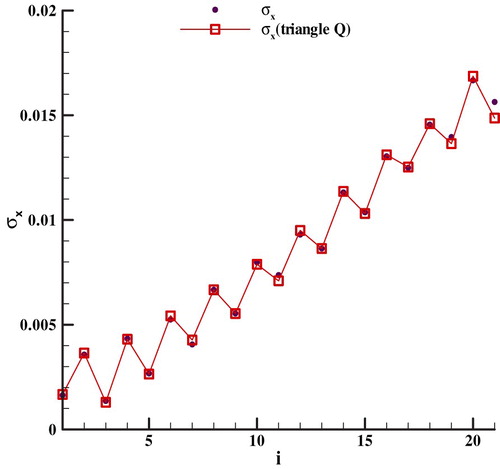
Figure 9. The heat flux estimated with greater noises.
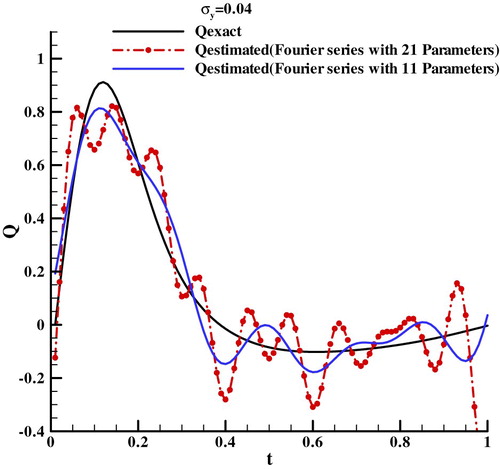
Figure 10. The variances of posterior distribution of heat flux with greater noises.
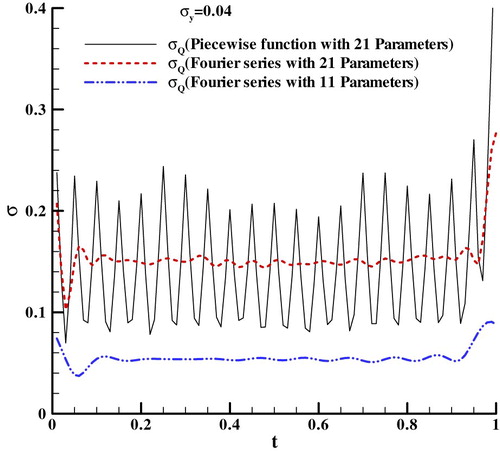
Figure 11. The estimation errors of different methods.
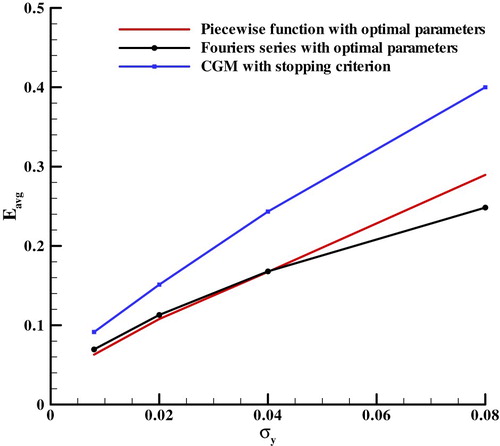
Figure 12. The standard deviation of the estimation heat flux in frequency domain.
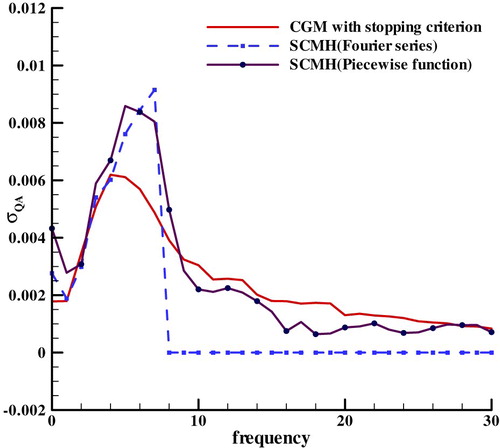
Table 1. Cross-correlation of coefficients of the sensitivity.
Table 2. Normalized average squared jumping distances.
Figure 13. Efficiency of the first component of piecewise function.
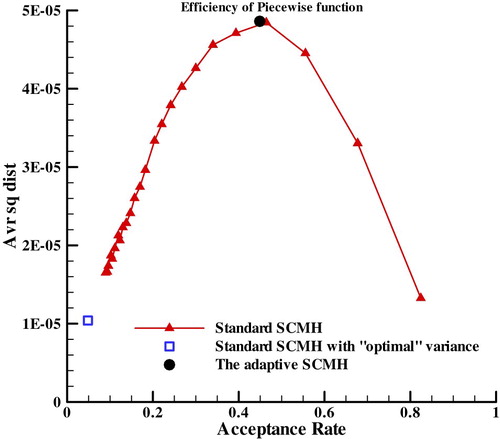
Figure 14. Efficiency of the first component of Fourier series.
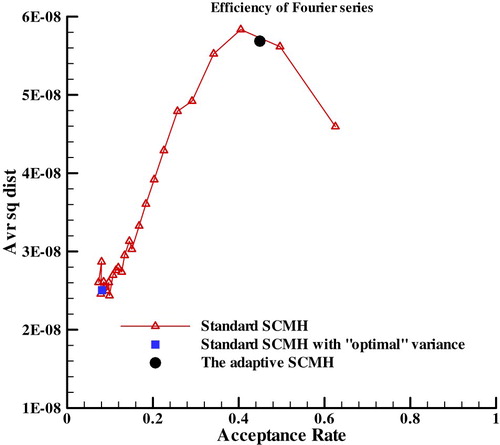
Figure 15. The comparison of experiment temperature and estimation result.
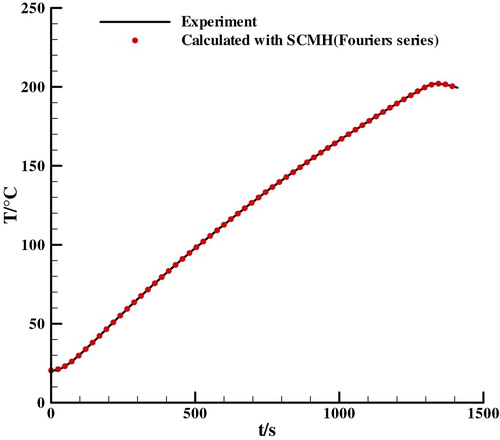
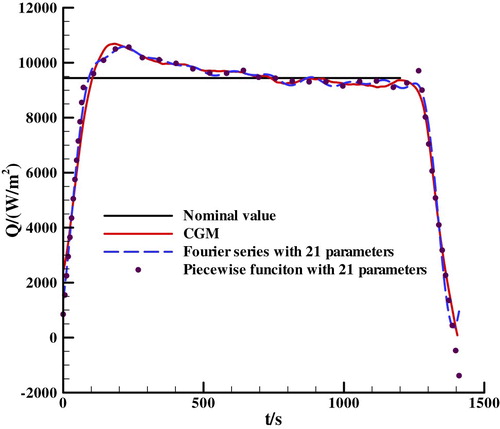
Figure 16. The comparison of the test nominal value and the heat flux estimated by CGM and SCMH.