Figures & data
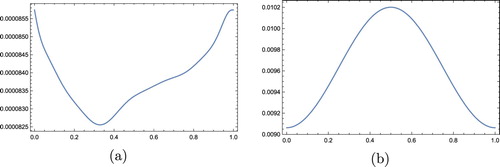
Figure 1. Relative error graphs of v in Example 1 at time for N = 30 and
in CGL points: (a) without noisy data and (b) with noisy data.
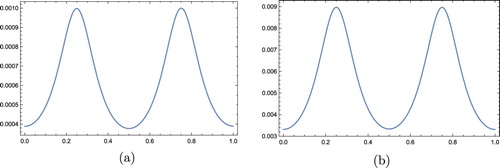
Figure 2. Numerical and exact solutions of Example 1 for N = 40, and
in CGL points.
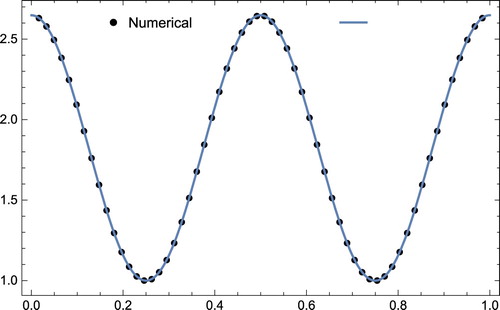
Table 1. Relative errors of  for Example 1; and regular grid points
Table 2. Relative errors of , for Example 1; and CGL grid points
Table 3. Relative errors of source parameter for Example 1; and regular grid points
Table 4. Relative errors of source parameter for Example 1; and CGL grid points
Figure 3. Absolute error graphs of v in Example 2 at time for N = 15 and
in CGL points: (a) without noisy data and (b) with noisy data.
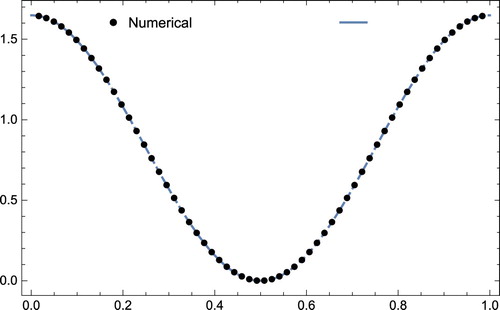
Figure 4. Numerical and exact solutions of Example 2 for
and
in CGL points.