Figures & data
Figure 1. An elastic solid with an inclusion and its finite element model.
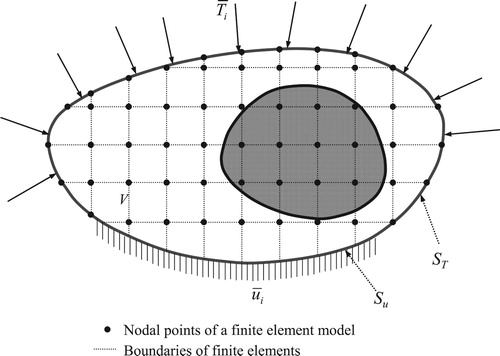
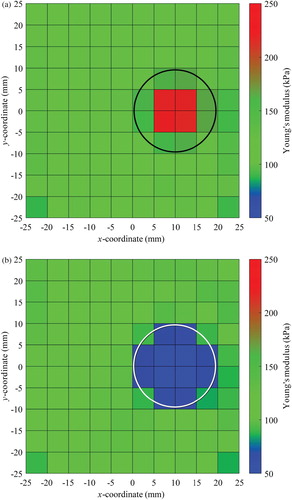
Figure 2. Geometry, boundary conditions and material properties of numerical examples.
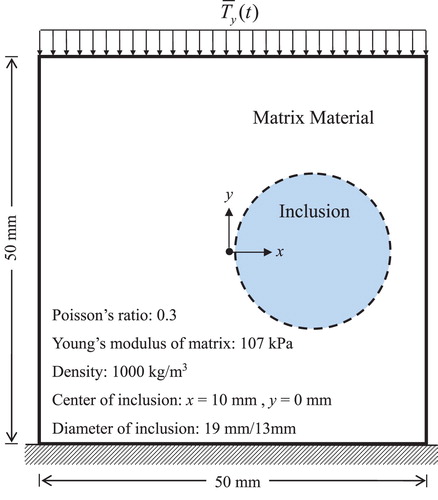
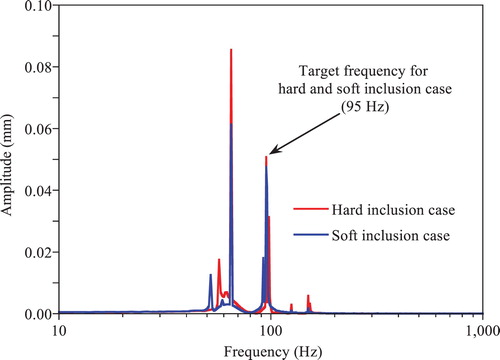
Figure 3. FFT of measured y-directional displacement at the centre of the elastic solid with hard and soft inclusion under free vibration.
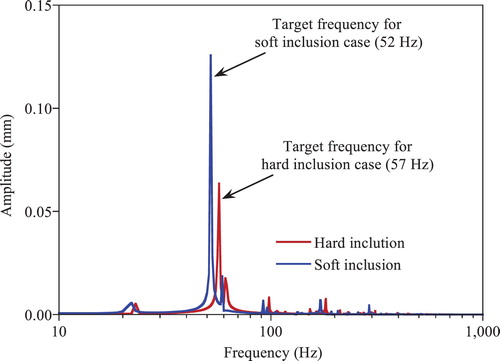
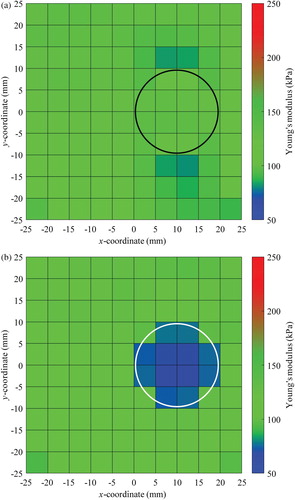
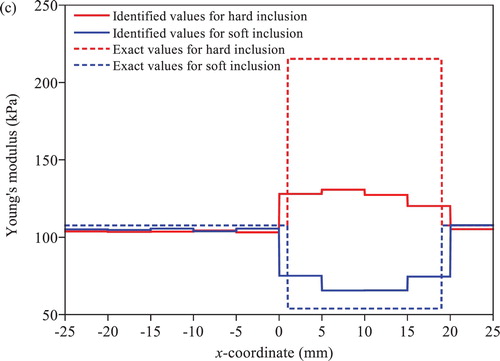
Figure 5. Identified Young’s moduli under free vibration by the T-S EEE for the hard inclusion case: (a) colour map of results without regularization (b) variation along the elements in the first layer above the centre line in x direction with/without regularization.
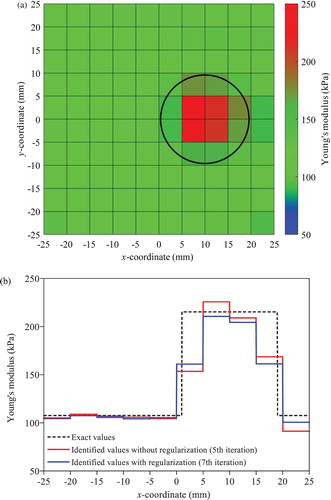
Figure 6. Identified Young’s moduli under free vibration by the T-S EEE for the soft inclusion case: (a) colour map of results without regularization (b) variation along the elements in the first layer above the centre line in x direction.
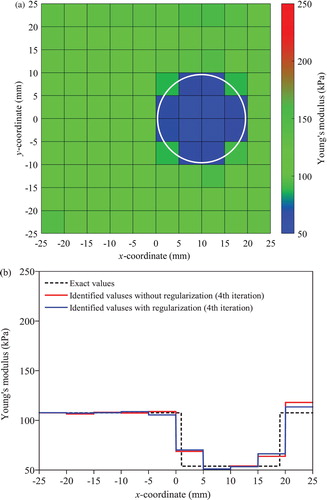
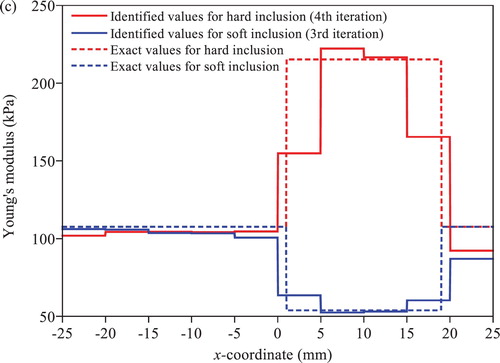
Figure 7. Convergence rates of the T-S EEE under free vibration.
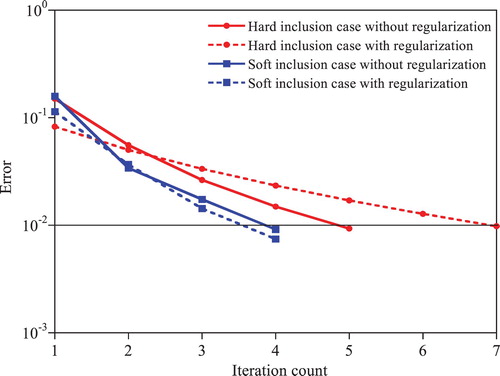
Figure 8. Identified Young’s moduli under free vibration by the T-S EEE without regularization for the hard inclusion case with 25 × 25 mesh layout: (a) colour map (b) variation along the elements in the centre layer in x direction.
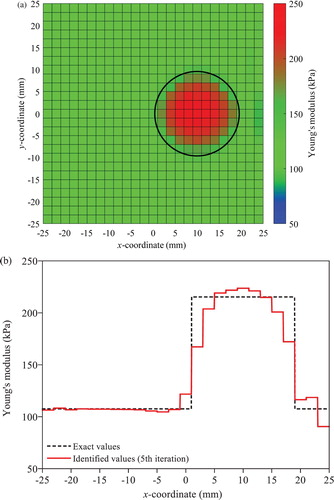
Figure 9. Identified Young’s moduli under free vibration by the T-S EEE without regulation for the hard inclusion with diameter of 13 mm: (a) colour map (b) variation along the elements in the first layer above the centre line in x direction.
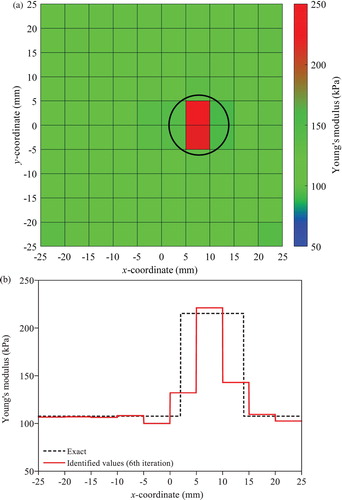
Figure 10. Identified Young’s moduli under free vibration by the T-S EEE without regulation for the hard inclusion with Young’s modulus of 160.5 kPa: (a) colour map (b) variation along the elements in the first layer above the centre line in x direction.
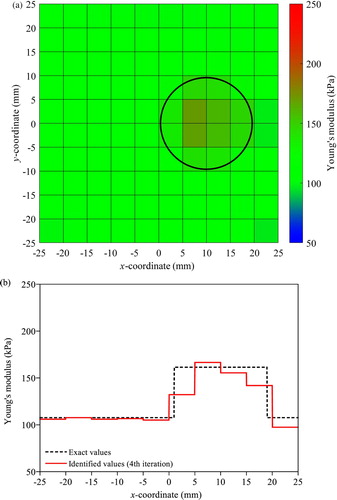
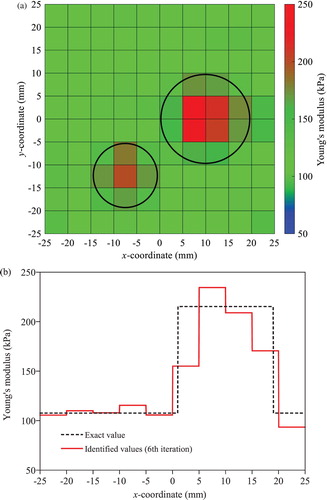
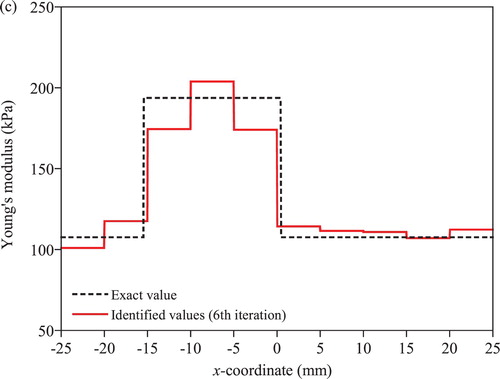
Figure 12. Identified Young’s moduli along the elements in the first layer above the centre line in x direction for three different damping ratios: (a) free vibration and (b) forced vibration.
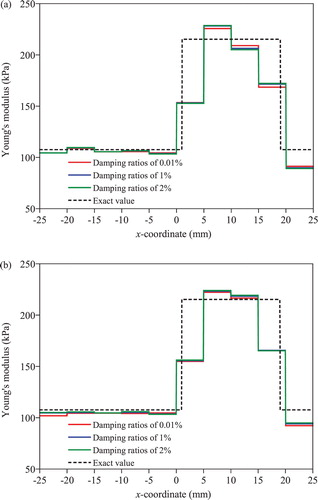
Figure 13. Effect of noise in measusrement (a) identified Young’s modulus of each element with and without noise; (b) Mean and standard deviation of identified Young’s modulus of each element by 100 Monte-Carlo Trials.
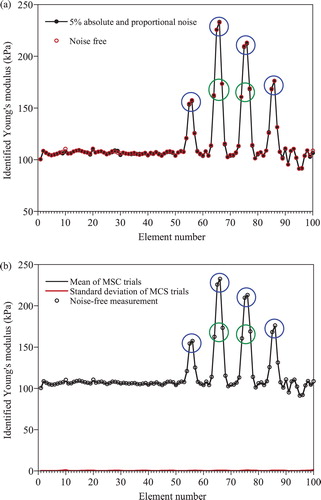
Figure 14. FFT of the y-directional displacement measured at the centre of the elastic solid with hard and soft inclusion under forced vibration.