Figures & data
Figure 1. The correct distribution .
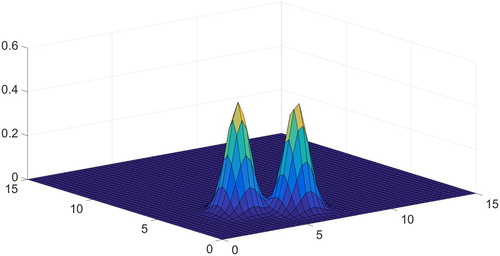
Figure 2. The result of performing minimization (4) in the case of 10% noise amplitude.
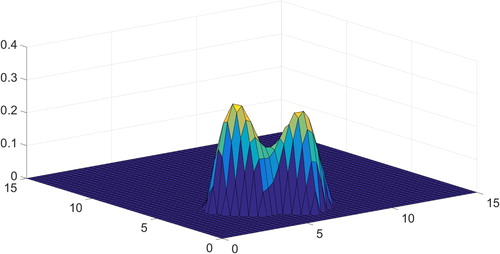
Figure 3. The result of performing minimization (4) in the case of 1% noise amplitude.
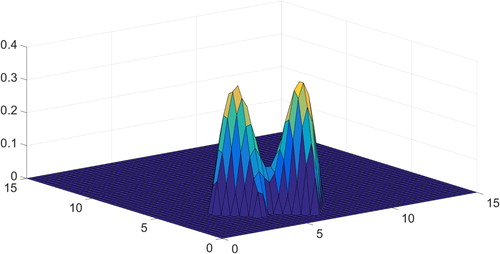
Figure 4. Diffraction pattern detected in Rheoscan in the case of mixture of rigid and normal cells in 1:1 proportion.
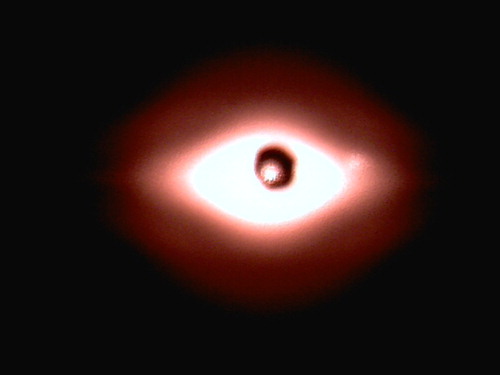
Figure 5. The dashed line shows the average value found by regularization. The solid line shows the same value found using the standard ektacytometry method. Case ‘B’ is on the left, it corresponds to normal cells. Case ‘C’ is on the right, it corresponds to the mixture of normal and hard cells in 1 to 1 proportion.
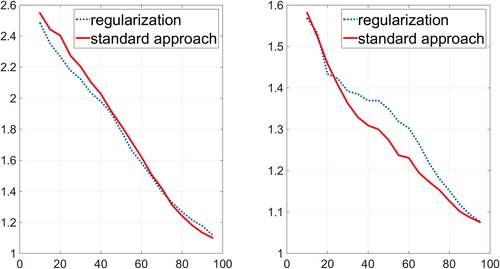
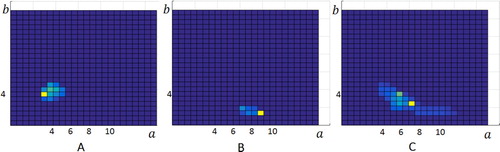
Figure 6. The result of performing minimization (4) in the case of mixture of rigid and normal erythrocytes using the diffraction patterns obtained from Rheoscan device. ‘A’ stands for the case of only rigid cells, ‘B’ for the case of only normal cells and ‘C’ stands for the mixture in 1:1 proportion.