Figures & data
Table 1. Relative errors in derivative approximation.
Table 2. Relative errors and the descent rates using different gradients.
Table 3. Relative errors and the descent rates using different gradients.
Figure 1. Noisy .
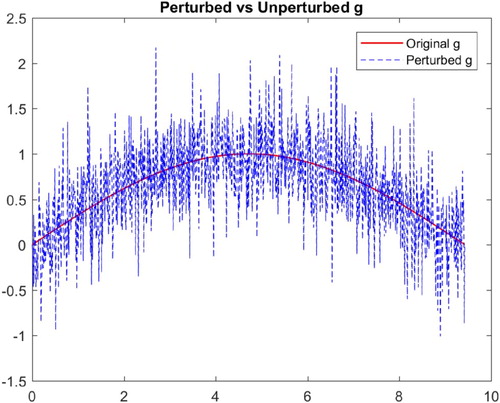
Figure 2. Inverse recovery of the derivative and
: (a) derivative
vs. ϕ and (b) recovery of
.
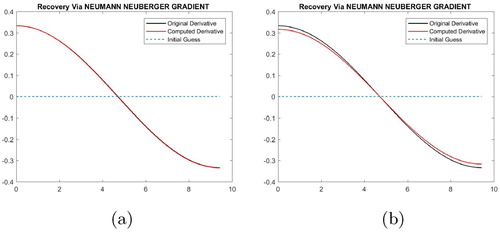
Figure 3. Recoveries using out method: (a) numerical derivative and (b) smooth approximation
.
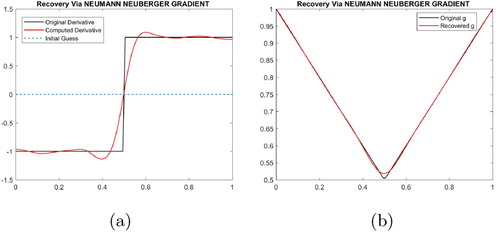
Figure 4. (a) Noisy data for Example 7.4 and (b) total variation regularization from [Citation1].
![Figure 4. (a) Noisy data for Example 7.4 and (b) total variation regularization from [Citation1].](/cms/asset/7c1cc03b-a261-421f-a9cf-9de70b630ec5/gipe_a_1763983_f0004_oc.jpg)
Figure 5. Integration smooths out the noise present in the data: (a) noisy vs exact g and (b) noisy
vs exact u.
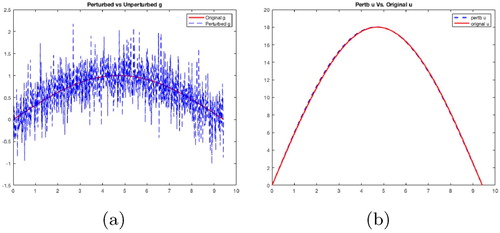
Figure 6. Fluctuations during the descent process. (a) , Example 7.1 (
) and (b)
, Example 7.2.
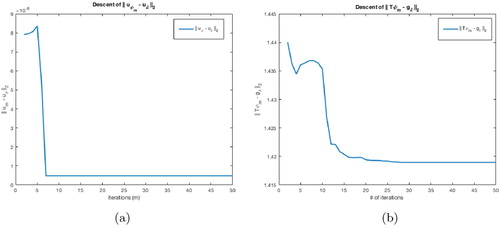
Figure 7. Relative errors in the recoveries during the descent process: (a) Example 7.2 and (b) Example 7.1 ().
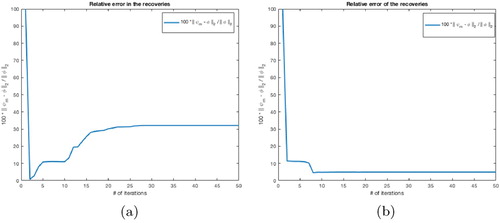
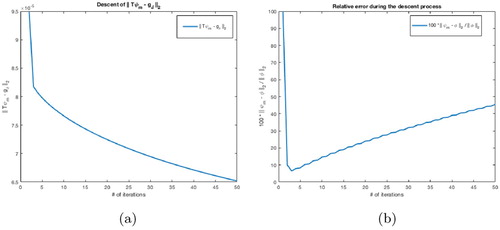
Figure 8. Landweber iterations on Example 7.1 (): (a)
-descent and (b) relative errors descent.