Figures & data
Figure 1. The distribution of the height-integrated accumulation of nitrogen dioxide from a point source measured by the Resource-P satellite (left figure). Distribution of the integral accumulation of nitrogen dioxide
in the near zone (right picture).
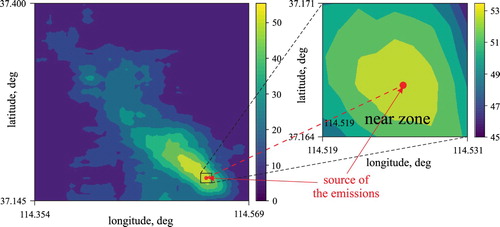
Figure 2. The distribution of the height-integral accumulation of nitrogen dioxide in the near zone obtained using the reconstructed parameters.
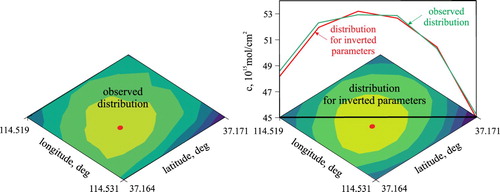
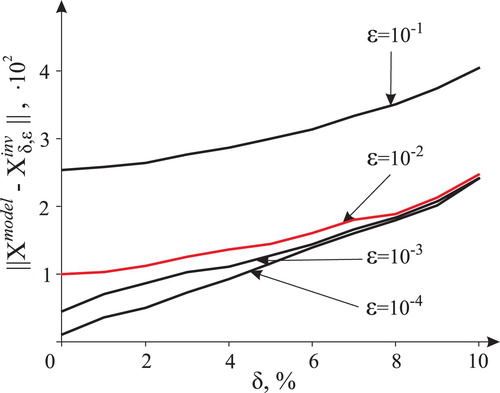
Figure 3. Dependence of on the noise level δ for different values of the small parameter ϵ.