
Figures & data
Figure 1. Sample image and its coordinate system in frequency domain. (a) 50*50 sample image. (b) Coordinate system of the sample image in frequency domain.
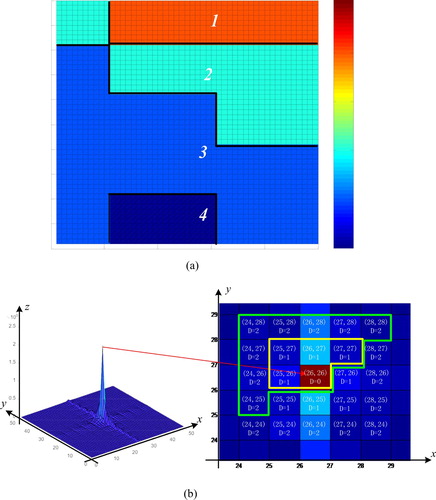
Figure 2. Workflow of PSO algorithm.
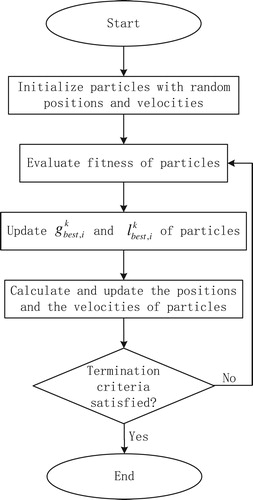
Figure 3. Feasibility experiment results. (a) Actual wave velocities and coordinates. (b) Normalized true wave velocity distribution after stress change. (c) Normalized true wave velocity distribution after stress change when . (d) Inversion result before stress change when
. (e) Inversion result after stress change when
.
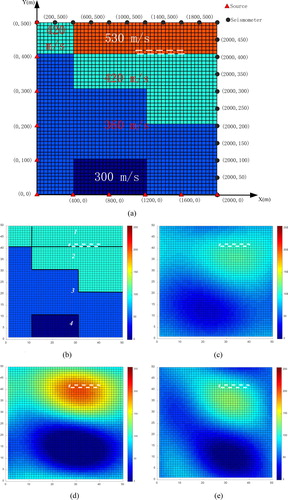
Figure 4. Energy ratio and distance of feasibility experiment results. (a) Global best and mean fitness function values. (b) Energy ratio of inversion results to true velocity distributions. (c) Distance between inversion results and true velocity distributions.
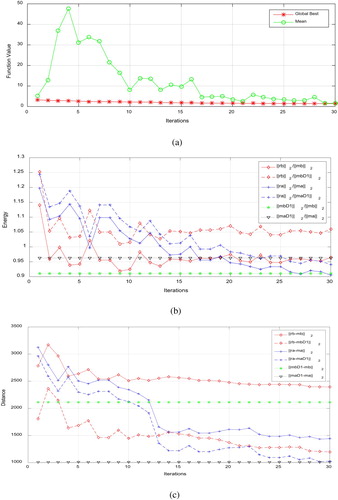
Table 1. Meanings of symbols in feasibility experiment.
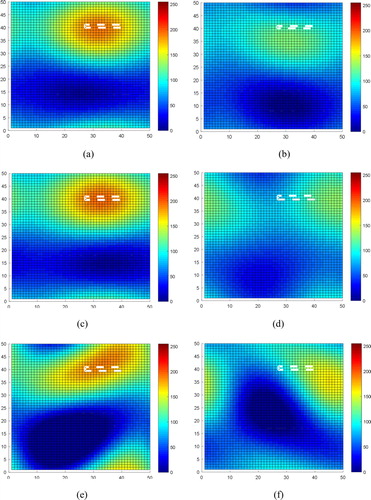
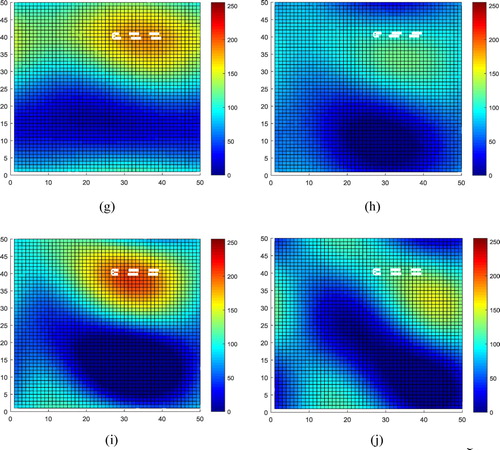
Figure 6. Distances and variances of these distances. (a) Distance between inversion results and true wave velocity distributions. (b) Variances of the distances.
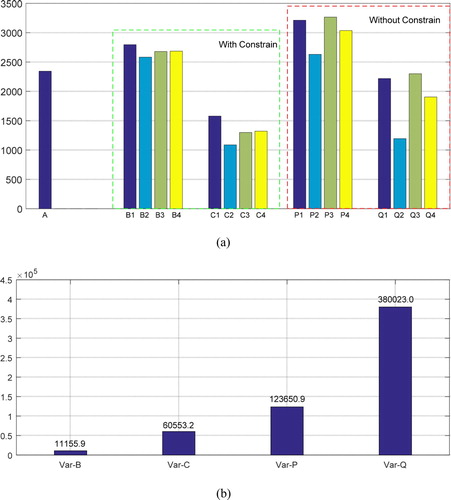
Table 2. Meanings of symbols in contrast experiment.
Data availability statement
All the computer codes are available at: https://github.com/feiyucq/Seismic-Tomography-with-Stress-Change-Direction-Constraint.git