Figures & data
Figure 1. Sparse structure of matrix , for n + 1 = 16 grid points on both directions.
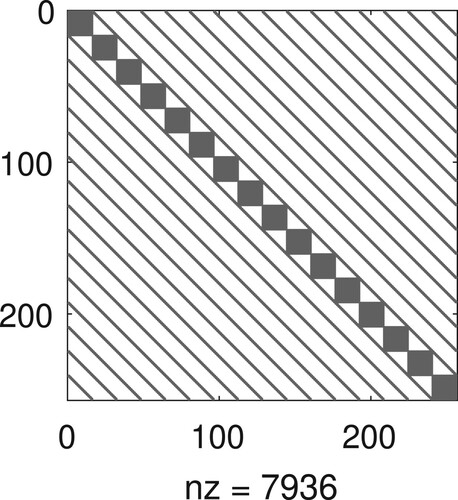
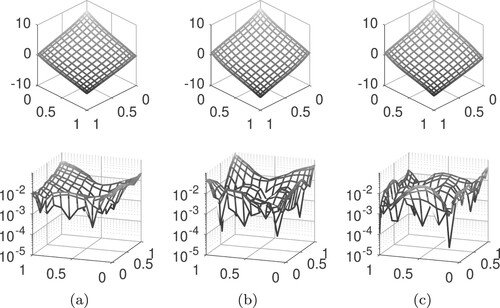
Figure 2. Numerical solutions for three time stages (top) and associated pointwise absolute error (bottom).
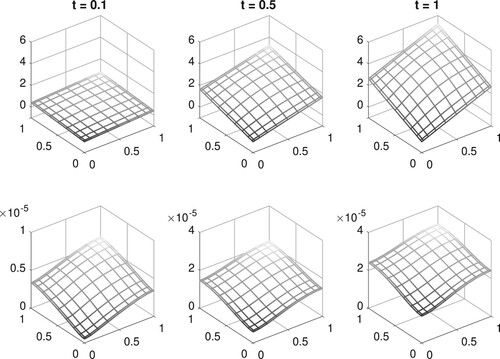
Figure 3. Example of grid, for n = 4, enumerated in accordance with Equation (Equation42(42)
(42) ), i.e, lexicographic order.
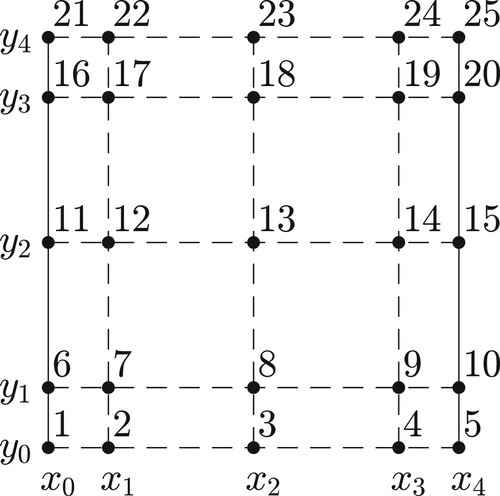
Figure 4. Example of FEM mesh's structure with 185 nodes, 328 triangles and global mesh size h = 0.1 (left), respective solution with CN () at time t = 1 (middle) and sparse structure of mass matrix
(right), for data used in Figure .
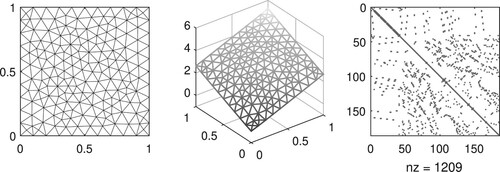
Table 1. Errors associated with FEM-based solutions for two global mesh sizes and errors associated with CPM.
Figure 5. Residual (left) and relative error between
and the exact conductivity
(right),
.
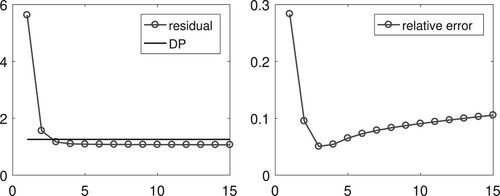
Figure 6. Comparison between solutions for calculated with different choices of
and α. For (d) and (e),
.
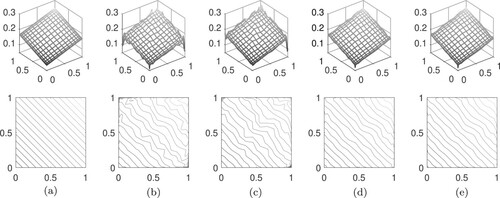
Table 2. Errors and number of iterations until DP is satisfied, for different choices of  and α, considering as exact .
Figure 7. Contour plots for every exact (top) and the respective approximation (bottom),
.
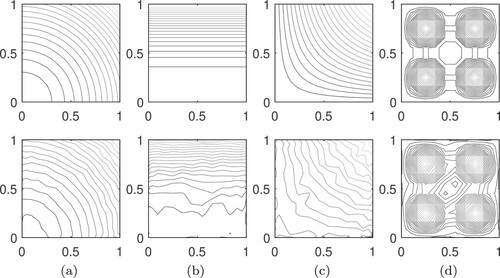
Table 3. Relative errors RE, interior error IE and number of LMM iterations until DP is satisfied.
Figure 8. Behavior of reconstruction results solution for different noise levels. Top: exact conductivities and respective approximations along the line x = 0.5. Bottom: absolute value of reconstruction errors along the line x = 0.5 and relative error RE.
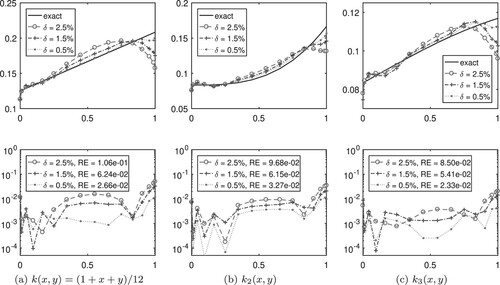
Table 4. Orthotropic test cases.
Table 5. Orthotropic results for test cases in Table .
Figure 9. Contour plots for every test case: 1 (top row), 2 (middle row) and 3 (bottom row).
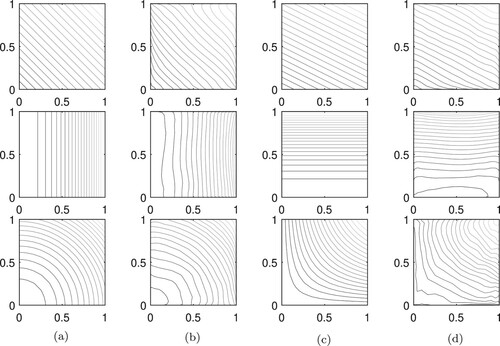
Figure 10. Computed temperature T (above) at time t = 1 using the reconstructions of and
and the absolute value of the error between FEM's T and its approximation (below).