
Figures & data
Figure 1. Problem geometry and sensor position.
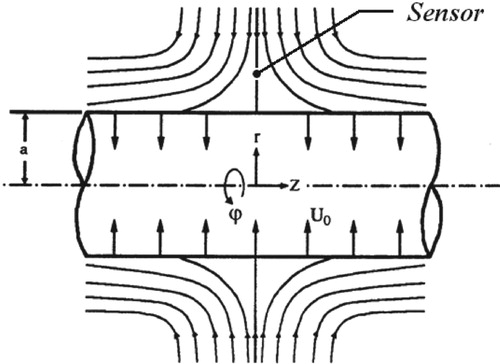
Table 1. Effect of number of nodes on local Nusselt number.
Figure 2. Three-dimensional picture of axisymmetric stagnation flow on a cylinder.
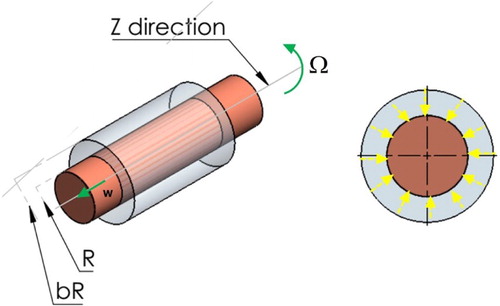
Table 2. Comparison of numerical and analytical results of f"(1).
Table 3. Analytical and numerical results of Nusselt number for Re = 0.1.
Table 4. Maximum and minimum values of the .
Table 5. Temperature history at point η1 = 1.06 for exponential function of wall heat flux and S = −0.1.
Figure 3. Variations of sensitivity coefficient for estimation of the heat flux in the form of exponential function.
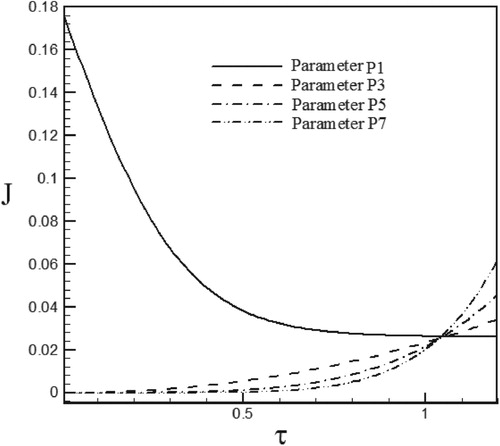
Figure 4. Variations of sensitivity coefficient for estimation of the heat flux in the form of sinus–cosines function.
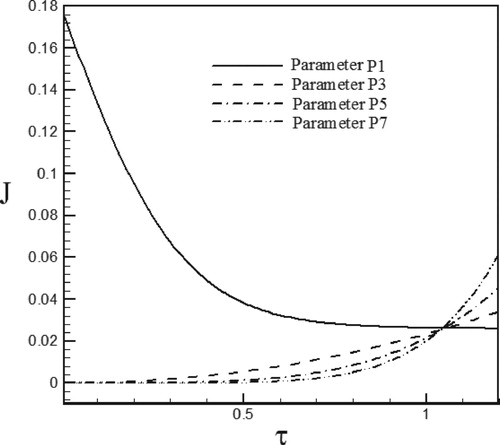
Figure 5. Variations of sensitivity coefficient for estimation of the heat flux in the form of triangular function.
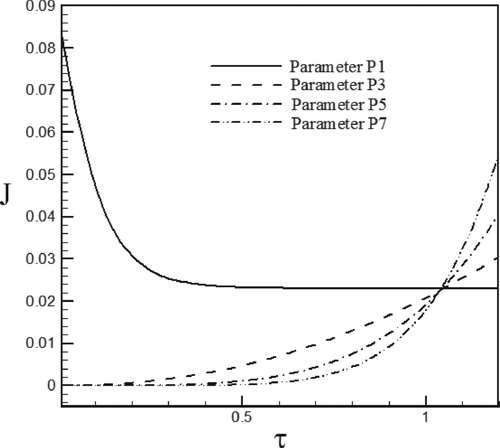
Figure 6. Variations of sensitivity coefficient for estimation of the heat flux in the form of trapezoidal function.
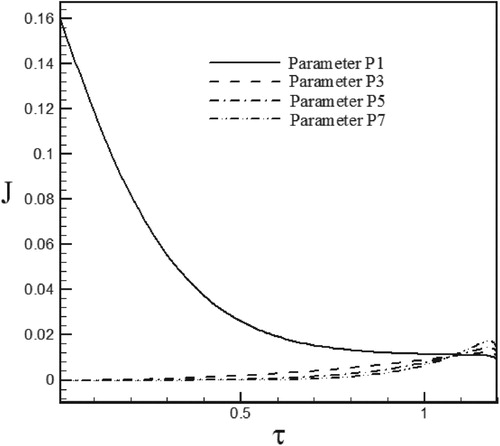
Figure 7. Calculated Heat flux with Re = 100 and S = −0.6 vs. the exact heat flux in the form of an exponential function.
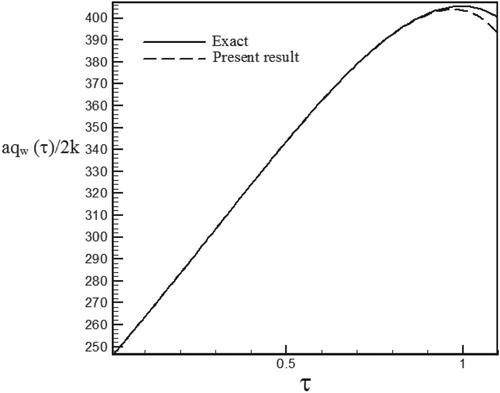
Figure 8. Temperature history at pointη1 = 1.06 with Re = 100 and S = −0.6 for calculated heat flux vs. exact heat flux in the form of an exponential function.
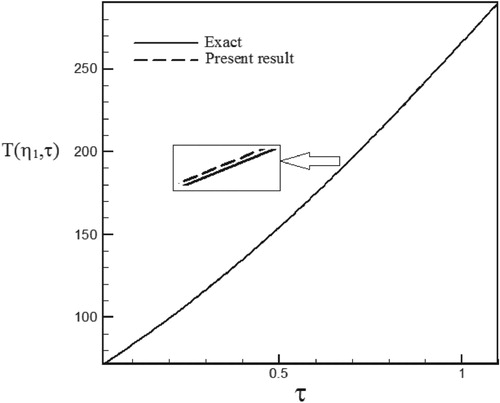
Figure 9. Calculated Heat flux with Re = 100 and S = −0.3 vs. the exact heat flux in the form of an exponential function.
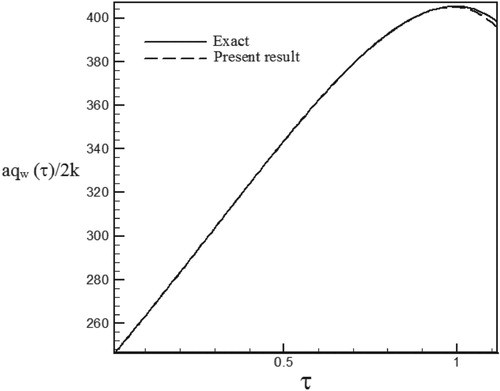
Figure 10. Temperature history at pointη1 = 1.06 with Re = 100 and S = −0.3 for calculated heat flux vs. exact heat flux in the form of an exponential function.
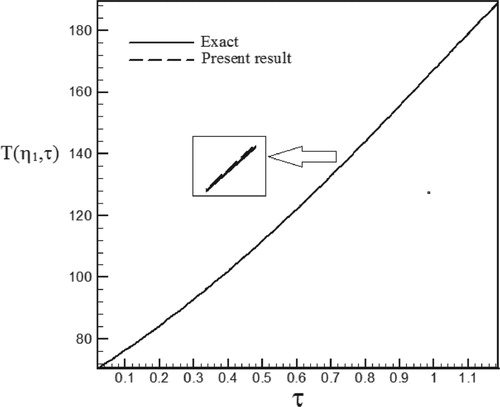
Figure 11. Calculated Heat flux with Re = 100 and S = 0.5 vs. the exact heat flux in the form of an exponential function.
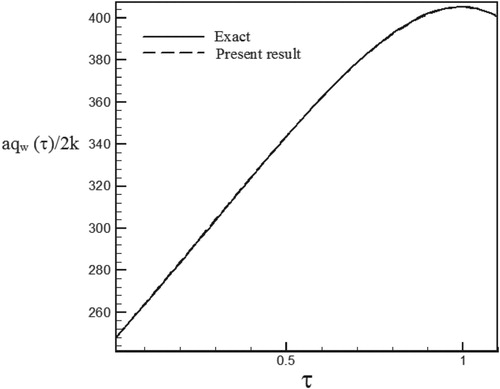
Figure 12. Temperature history at pointη1 = 1.06 with Re = 100 and S = 0.5 for calculated heat flux vs. exact heat flux in the form of an exponential function.
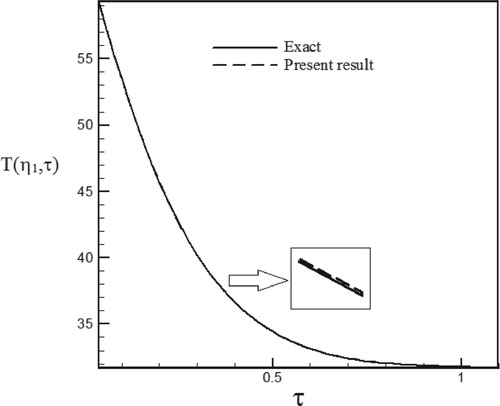
Figure 13. Calculated Heat flux with Re = 300 and S = −0.1 vs. the exact heat flux in the form of a sinus–cosines function.
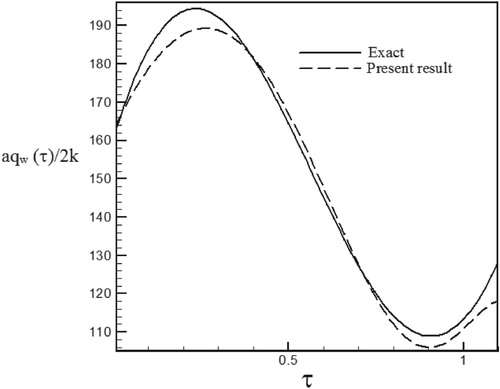
Figure 14. Temperature history at pointη1 = 1.0225 with Re = 300 and S = −0.1 for calculated heat flux vs. exact heat flux in the form of a sinus–cosines function.
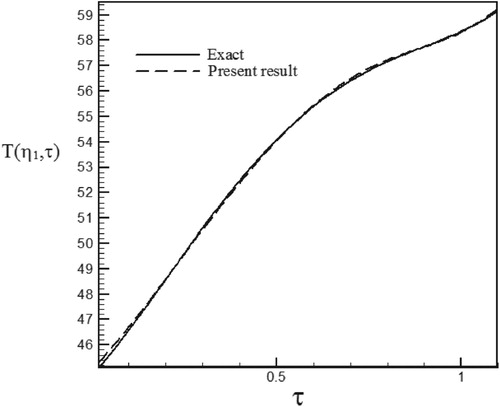
Figure 15. Calculated Heat flux with Re = 300 and S = 0.1 vs. the exact heat flux in the form of a sinus–cosines function.
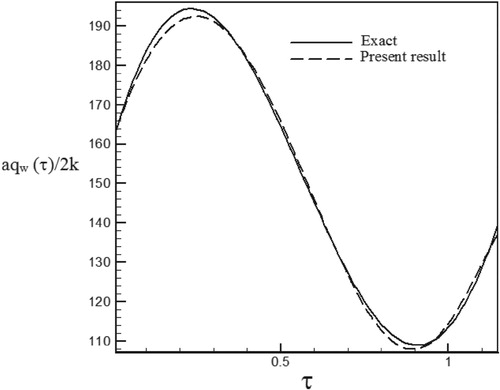
Figure 16. Temperature history at pointη1 = 1.015 with Re = 300 and S = 0.1 for calculated heat flux vs. exact heat flux in the form of a sinus–cosines function.
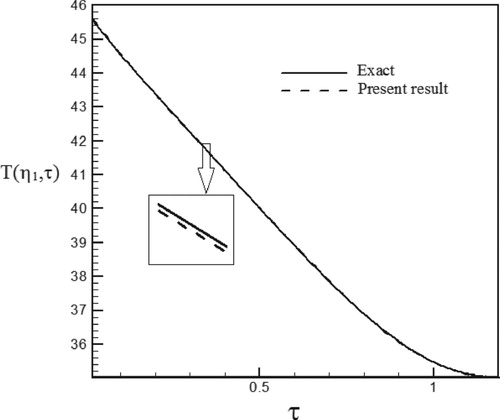
Figure 17. Calculated Heat flux with Re = 300 and S = 0.3 vs. the exact heat flux in the form of a sinus–cosines function.
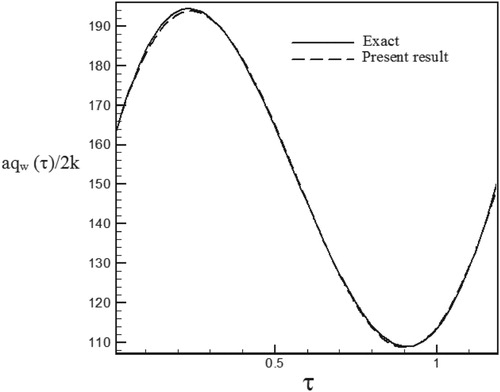
Figure 18. Temperature history at pointη1 = 1.015 with Re = 300 and S = 0.3 for calculated heat flux vs. exact heat flux in the form of a sinus–cosines function.
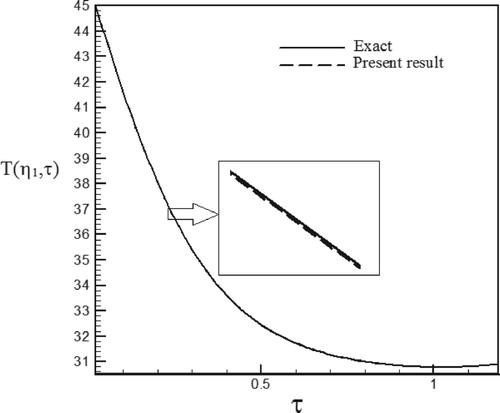
Figure 19. Calculated heat flux with Re = 200 and S = −0.1 vs. the exact heat flux in the form of a triangular function.
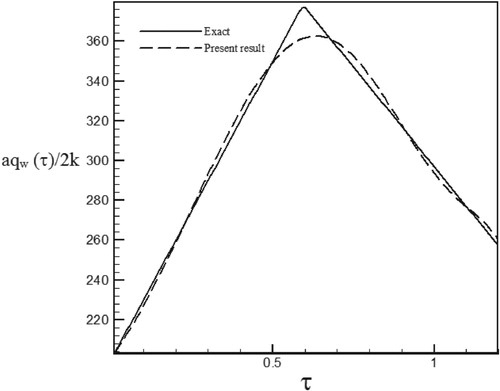
Figure 20. Temperature history at pointη1 = 1.005 with Re = 200 and S = −0.1 for calculated heat flux vs. exact heat flux in the form of a triangular function.
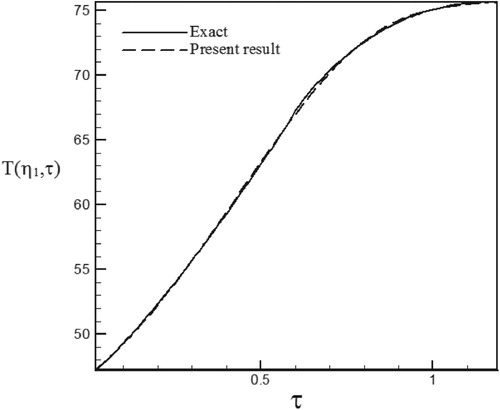
Figure 21. Calculated Heat flux with Re = 200 and S = 0.5 vs. the exact heat flux in the form of a triangular function.
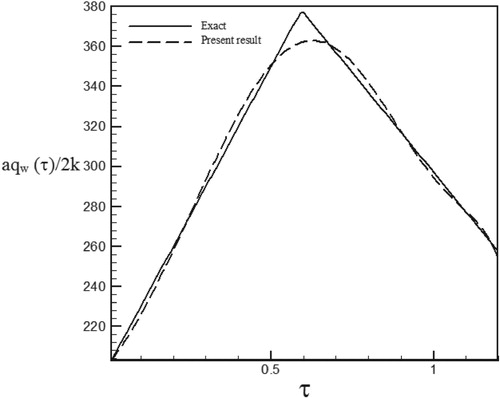
Figure 22. Temperature history at pointη1 = 1.005 with Re = 200 and S = 0.5 for calculated heat flux vs. exact heat flux in the form of a triangular function.
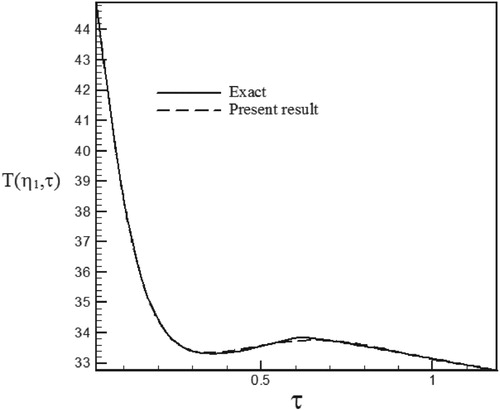
Figure 23. Calculated Heat flux with Re = 200 and S = 1 vs. the exact heat flux in the form of a triangular function.
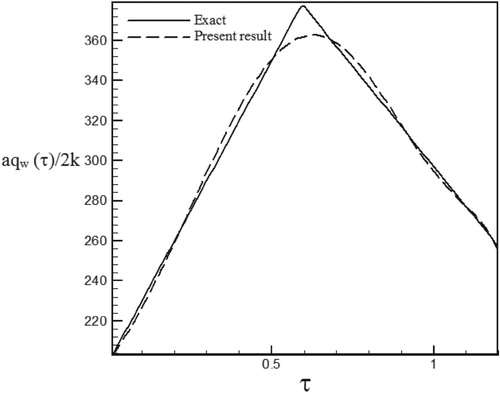
Figure 24. Temperature history at pointη1 = 1.005 with Re = 200 and S = 1 for calculated heat flux vs. exact heat flux in the form of a triangular function.
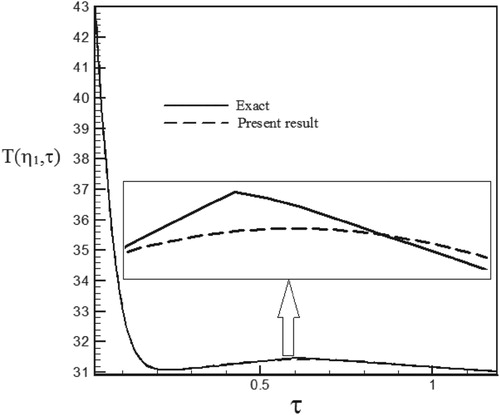
Figure 25. Calculated heat flux with Re = 150 and S = −0.1 vs. the exact heat flux in the form of a trapezoidal function.
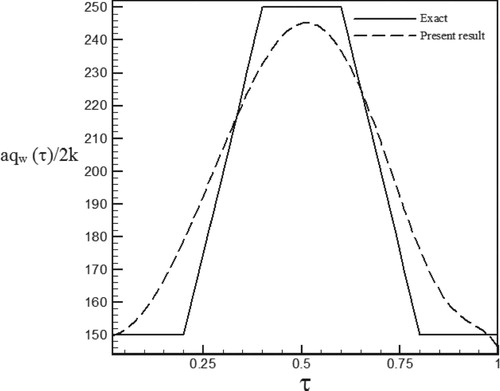
Figure 26. Temperature history at pointη1 = 1.03 with Re = 150 and S = −0.1 for calculated heat flux vs. exact heat flux in the form of a trapezoidal function.
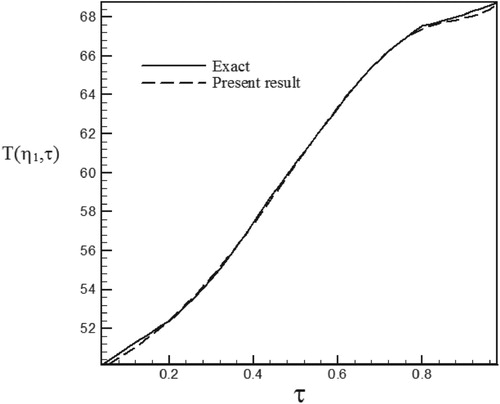
Figure 27. Calculated Heat flux with Re = 150 and S = 0.5 vs. the exact heat flux in the form of a trapezoidal function.
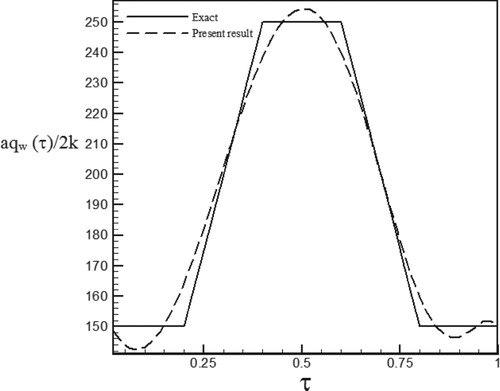
Figure 28. Temperature history at pointη1 = 1.005 with Re = 150 and S = 0.5 for calculated heat flux vs. exact heat flux in the form of a trapezoidal function.
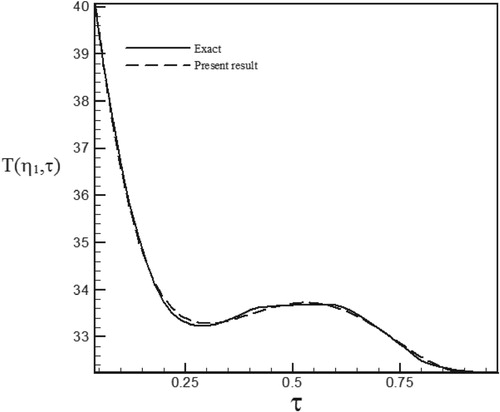
Figure 29. Calculated Heat flux with Re = 150 and S = 1 vs. the exact heat flux in the form of a trapezoidal function.
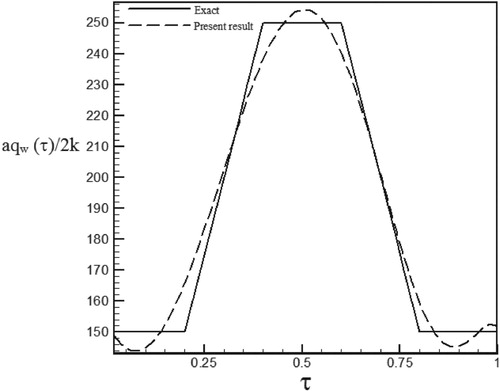
Figure 30. Temperature history at pointη1 = 1.005 with Re = 150 and S = 1 for calculated heat flux vs. exact heat flux in the form of a trapezoidal function.
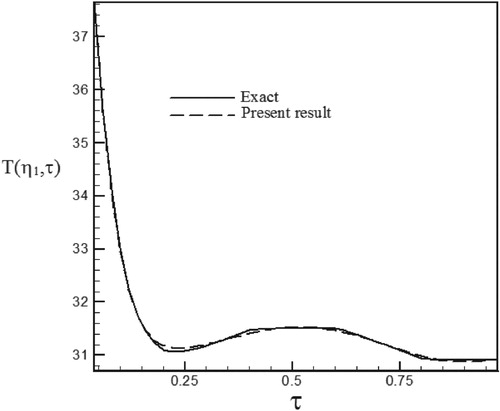
Figure 31. Calculated heat flux with Re = 100 and S = −0.6 with noisy data (σ = 0.01Tmax) vs. the exact heat flux in the form of an exponential function.
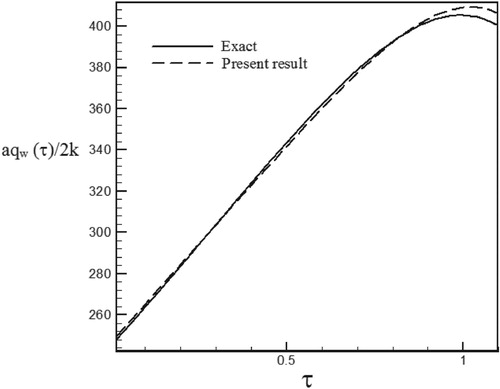
Figure 32. Calculated heat flux with Re = 100 and S = −0.6 with noisy data (σ = 0.03Tmax) vs. the exact heat flux in the form of an exponential function.
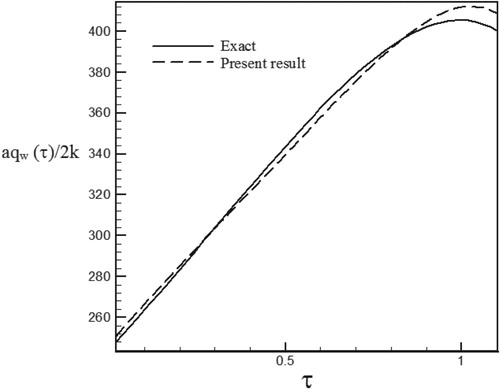
Figure 33. Calculated heat flux with Re = 100 and S = −0.3 with noisy data (σ = 0.01Tmax) vs. the exact heat flux in the form of an exponential function.
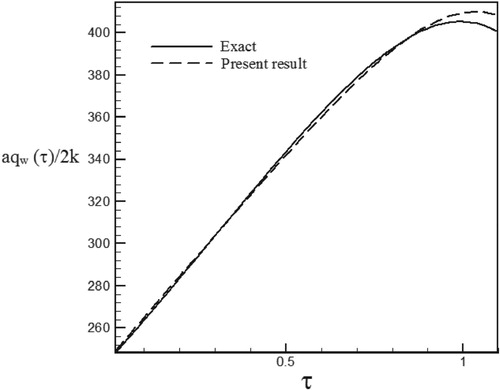
Figure 34. Calculated heat flux with Re = 100 and S = −0.3 with noisy data (σ = 0.03Tmax) vs. the exact heat flux in the form of an exponential function.
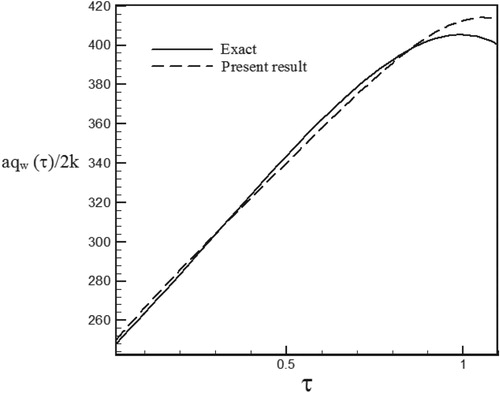
Figure 35. Calculated heat flux with Re = 100 and S = 0.5 with noisy data (σ = 0.01Tmax) vs. the exact heat flux in the form of an exponential function.
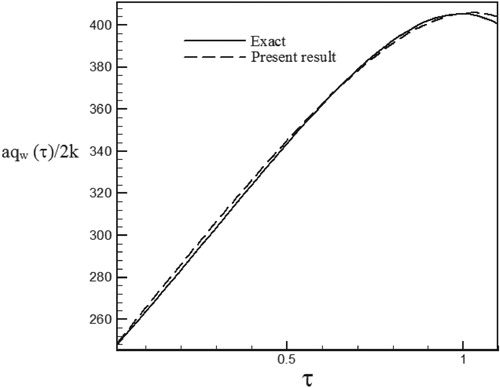
Figure 36. Calculated heat flux with Re = 100 and S = 0.5 with noisy data (σ = 0.03Tmax) vs. the exact heat flux in the form of an exponential function.
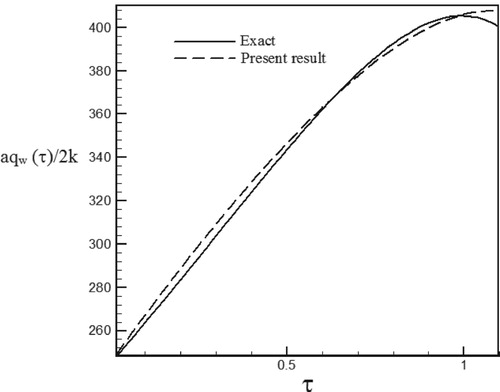
Figure 37. Calculated heat flux with Re = 300 and S = −0.1 with noisy data (σ = 0.01Tmax) vs. the exact heat flux in the form of a sinus–cosines function.
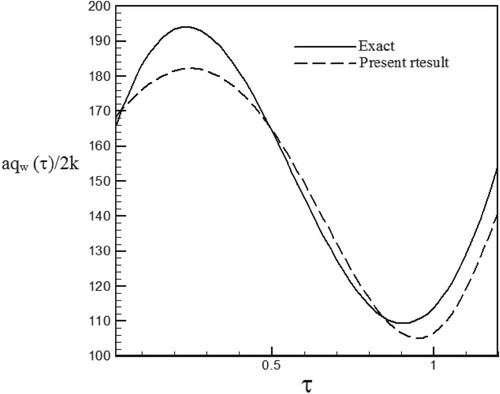
Figure 38. Calculated heat flux with Re = 300 and S = −0.1 with noisy data (σ = 0.03Tmax) vs. the exact heat flux in the form of a sinus–cosines function.
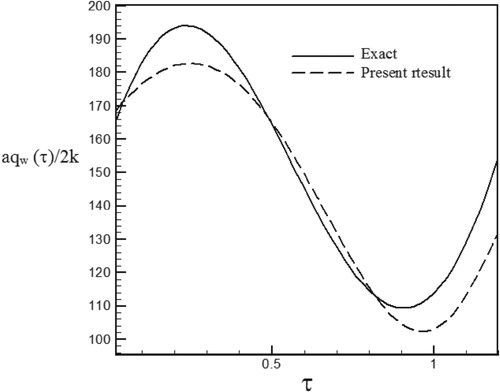
Figure 39. Calculated heat flux with Re = 300 and S = 0.1 with noisy data (σ = 0.01Tmax) vs. the exact heat flux in the form of a sinus–cosines function.
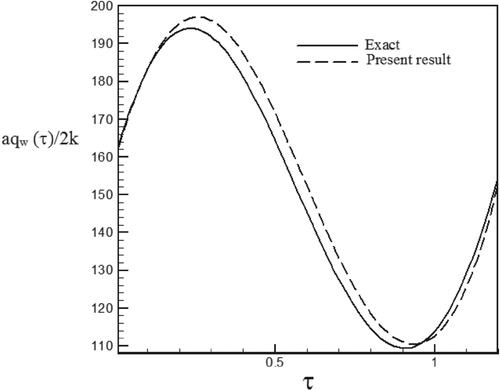
Figure 40. Calculated heat flux with Re = 300 and S = 0.1 with noisy data (σ = 0.03Tmax) vs. the exact heat flux in the form of a sinus–cosines function.
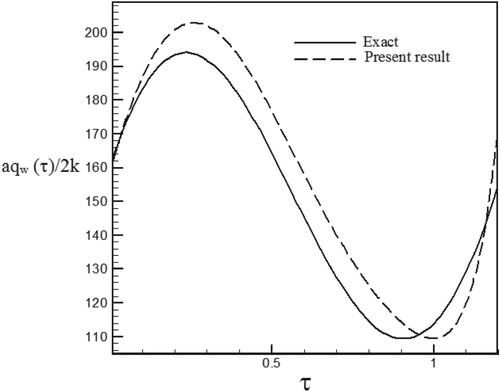
Figure 41. Calculated heat flux with Re = 300 and S = 0.3 with noisy data (σ = 0.01Tmax) vs. the exact heat flux in the form of a sinus–cosines function.
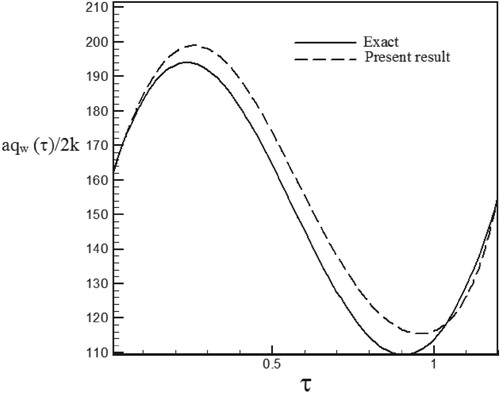
Figure 42. Calculated heat flux with Re = 300 and S = 0.3 with noisy data (σ = 0.03Tmax) vs. the exact heat flux in the form of a sinus–cosines function.
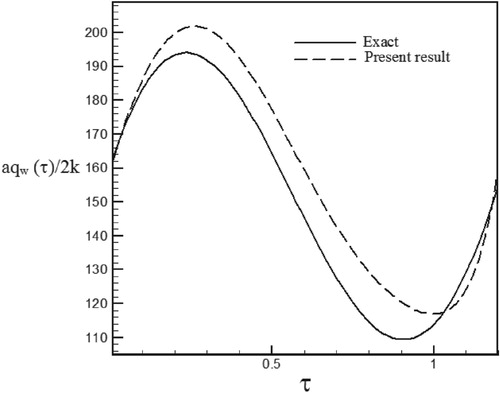
Figure 43. Calculated heat flux with Re = 200 and S = −0.1 with noisy data (σ = 0.01Tmax) vs. the exact heat flux in the form of a triangular function.
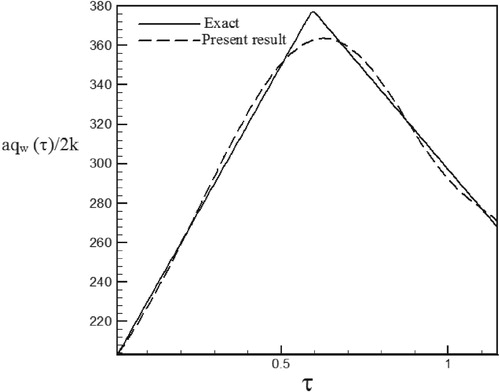
Figure 44. Calculated heat flux with Re = 200 and S = −0.1 with noisy data (σ = 0.03Tmax) vs. the exact heat flux in the form of a triangular function.
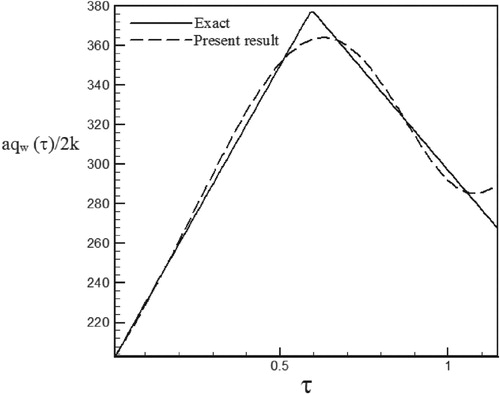
Figure 45. Calculated heat flux with Re = 200 and S = 0.5 with noisy data (σ = 0.01Tmax) vs. the exact heat flux in the form of a triangular function.
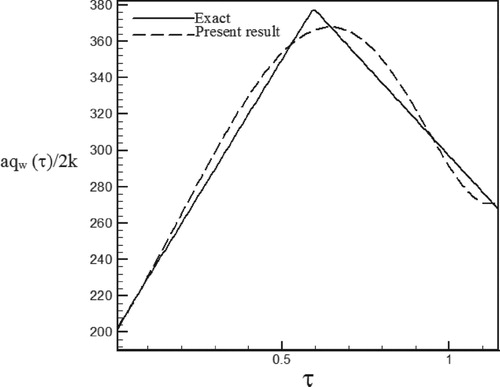
Figure 46. Calculated heat flux with Re = 200 and S = 0.5 with noisy data (σ = 0.03Tmax) vs. the exact heat flux in the form of a triangular function.
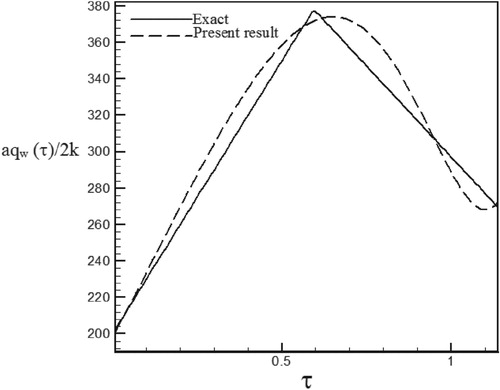
Figure 47. Calculated heat flux with Re = 200 and S = 1 with noisy data (σ = 0.01Tmax) vs. the exact heat flux in the form of a triangular function.
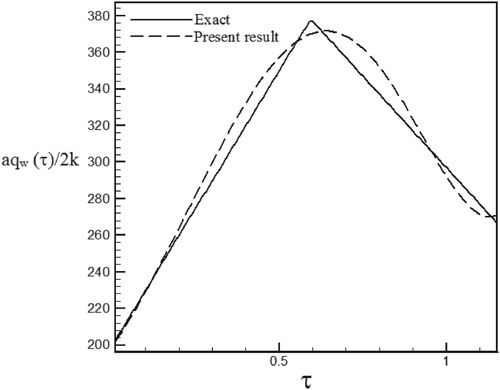
Figure 48. Calculated heat flux with Re = 200 and S = 1 with noisy data (σ = 0.03Tmax) vs. the exact heat flux in the form of a triangular function.
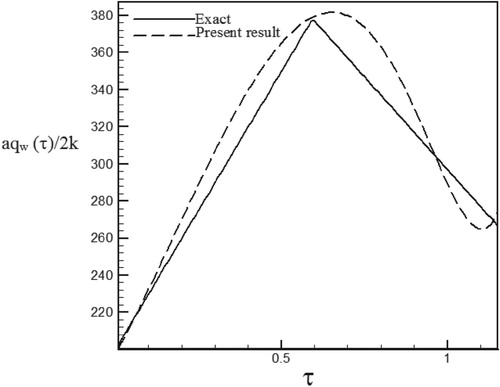
Figure 49. Calculated heat flux with Re = 150 and S = −0.1 with noisy data (σ = 0.01Tmax) vs. the exact heat flux in the form of a trapezoidal function.
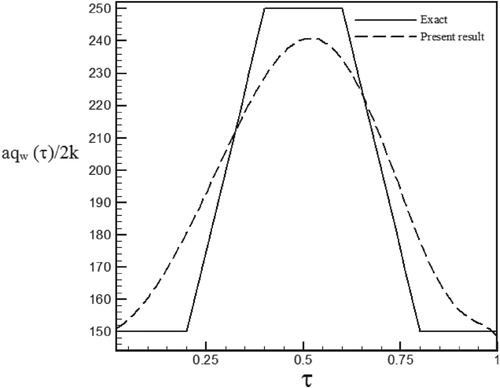
Figure 50. Calculated heat flux with Re = 150 and S = −0.1 with noisy data (σ = 0.03Tmax) vs. the exact heat flux in the form of a trapezoidal function.
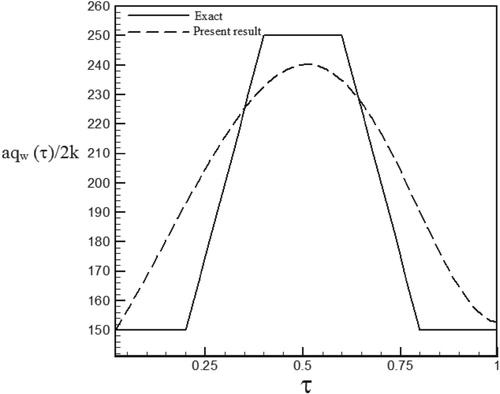
Figure 51. Calculated heat flux with Re = 150 and S = 0.5 with noisy data (σ = 0.01Tmax) vs. the exact heat flux in the form of a trapezoidal function.
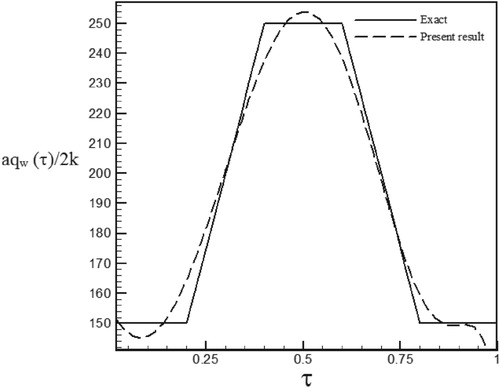
Figure 52. Calculated heat flux with Re = 150 and S = 0.5 with noisy data (σ = 0.03Tmax) vs. the exact heat flux in the form of a trapezoidal function.
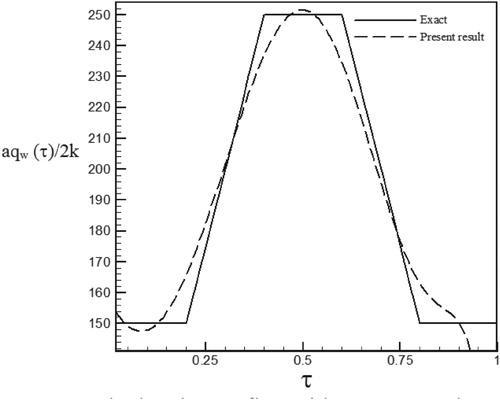
Figure 53. Calculated heat flux with Re = 150 and S = 1 with noisy data (σ = 0.01Tmax) vs. the exact heat flux in the form of a trapezoidal function.
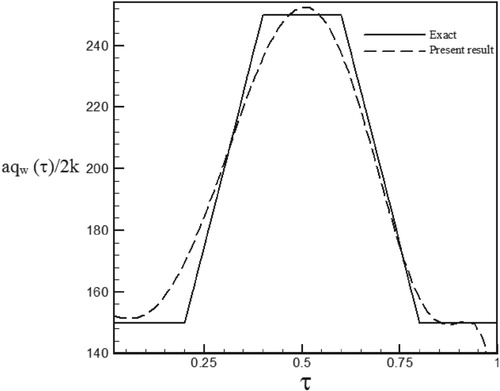
Figure 54. Calculated heat flux with Re = 150 and S = 1 with noisy data (σ = 0.03Tmax) vs. the exact heat flux in the form of a trapezoidal function.
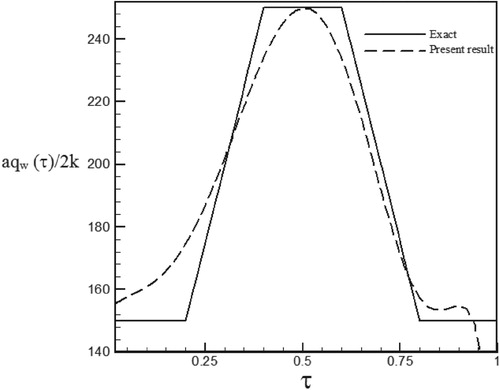
Table 6. Temperature history at point η1 = 1.0225 for sinus–cosines function of wall heat flux and S=−0.1.
Table 7. Temperature history at point η1 = 1.005 for triangular function of wall heat flux and S = −0.1.
Table 8. Temperature history at point η1 = 1.03 for trapezoidal function of wall heat flux and S = −0.1.
Table 9. RMS error for exponential function of wall heat flux.
Table 10. RMS error for sinus–cosines function of wall heat flux.
Table 11. RMS error for triangular function of wall heat flux.
Table 12. RMS error for trapezoidal function of wall heat flux.