Figures & data
Figure 1. Domain .
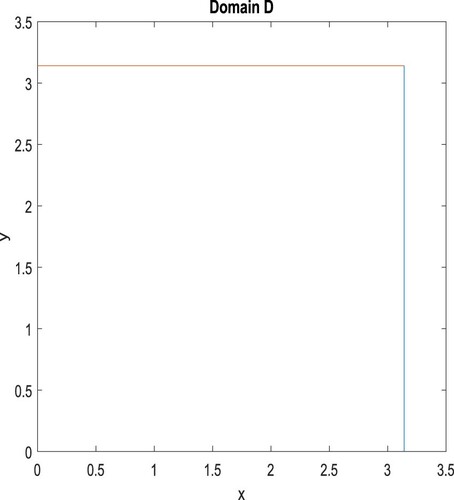
Figure 2. The accurate and numerical solutions of . The exact solution is shown with dashes line.
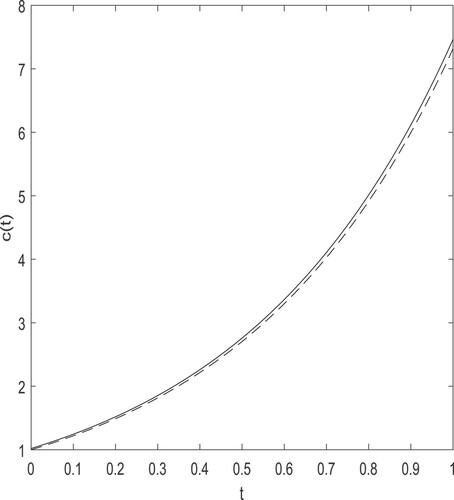
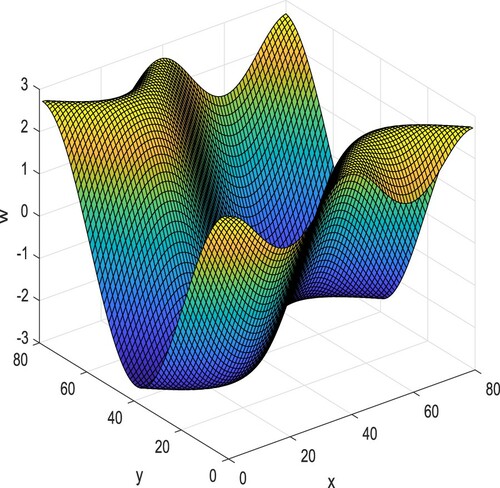
Figure 3. The numerical solution of .
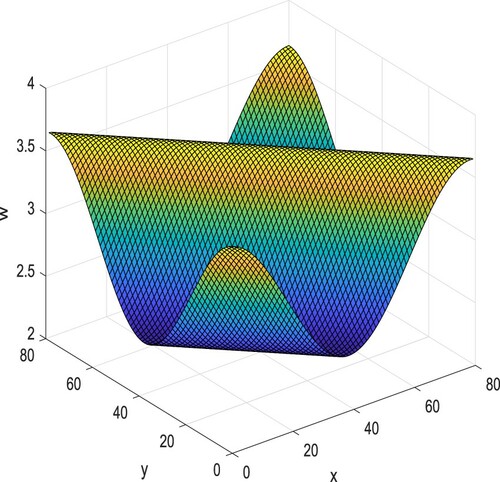
Table 1. The relative errors for the functions and
in different step sizes.
Table 2. The relative errors for the functions and
in different expected tolerance.
Table 3. The relative errors with some noisy data for the functions and
in
.
Table 4. The relative errors with some noisy data for the functions and
in
.
Figure 4. The accurate and numerical solutions of . The exact solution is shown with dashes line.
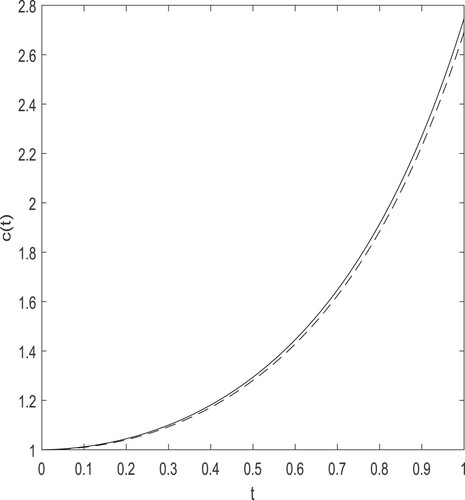
Figure 5. The numerical solution of .