
Figures & data
Figure 1. MFM.
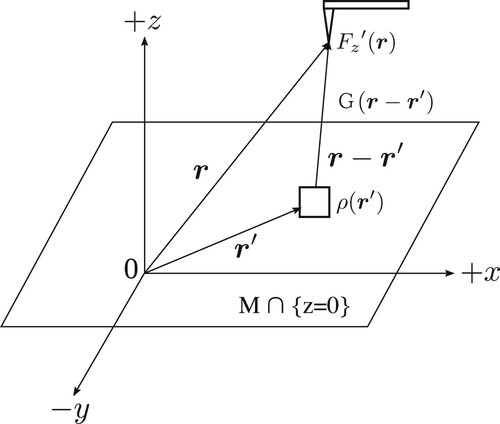
Figure 2. Cell discretization.
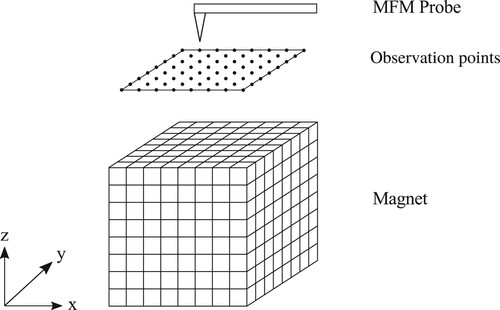
Figure 3. Numbering cells.
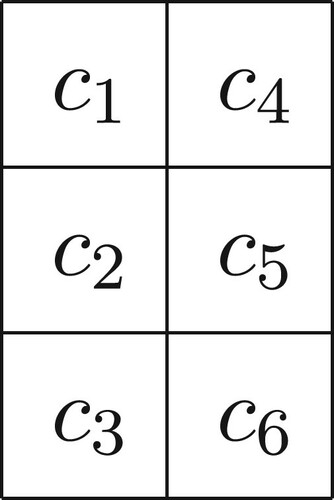
Figure 4. Magnetic moments and charges.
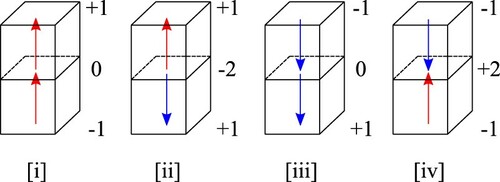
Figure 5. Complexity
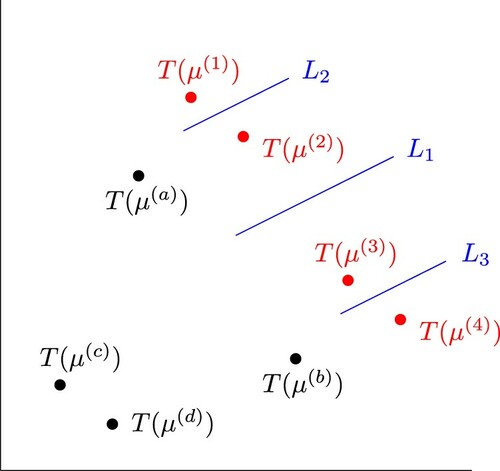
Table 1. ‘Practical’ rank of G (observation points: ).
Table 2. ‘Practical’ rank of G (Observation points: ).
Table 3. ‘Practical’ rank of G (observation points: ).
Table 4. ‘Practical’ rank of G (Observation points: ).
Figure 6. Distributions of
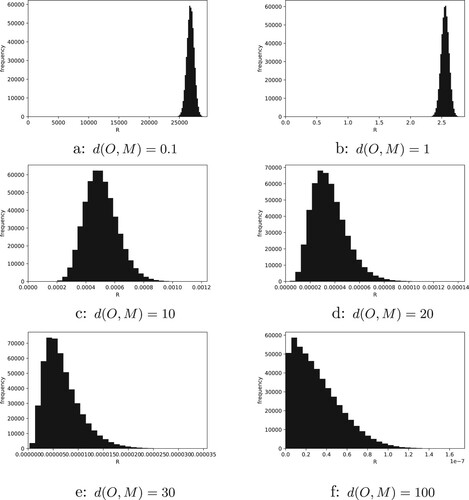
Table 5. Minimum and average of
.
Table 6. Minimum and average of
.
Table 7. Minimum and maximum of
Table 8. Minimum and maximum of
Table 9. Minimum and average of
.
Table 10. Minimum and average of
.
Table 11. Execution environment.
Figure 7. Convolutional auto encoder.
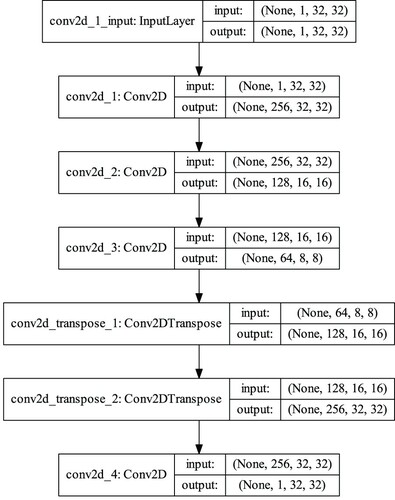
Table 12. Reversal rates.
Table 13. Estimation performances of each rate.
Table 14. Estimation performances of each .
Table 15. Estimation performance for the size of the problem and the number of filters.
Table 16. Estimation performance when no error occurs in the upper pieces.
Table 17. Estimation performance for cases with noise.
Table 18. Estimation performance of the iteration method ().
Table 19. Estimation performance of the iteration method ().
Data availability
All the data sets used in this study were randomly generated.