
Figures & data
Figure 1. Schematic diagram of three layers in layered media.
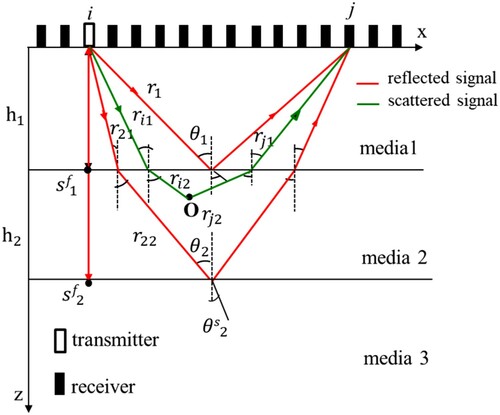
Figure 2. Signals received by the array element for (a) case 1, (b) case 2, and (c) case 3.
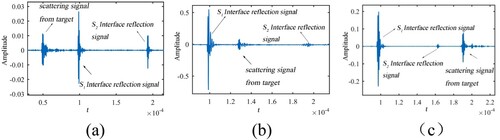
Table 1. Parameters of the layered media.
Figure 3. SIR for different emitter–receiver pairs at interface for (a) case 1, (c) case 2, and (e) case 3, at
interface for (b) case 1, (d) case 2, and (f) case 3, respectively.
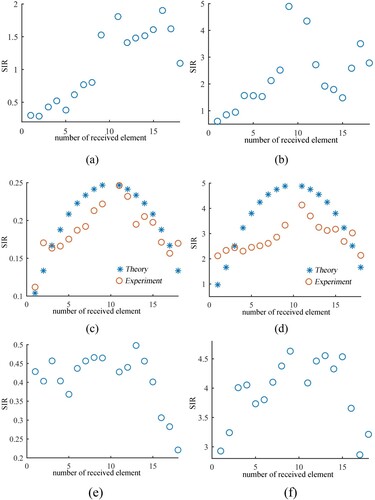
Figure 4. Results of the TR–RTM process for two interface-reflected signals (a) S1 and (b) S2 in case 2.
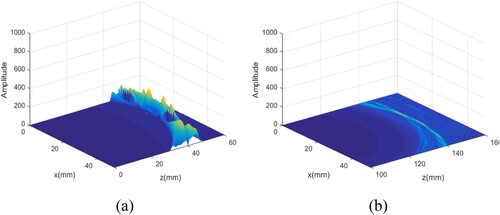
Figure 5. Acoustic field (a) distribution map of the target signal in case 2.
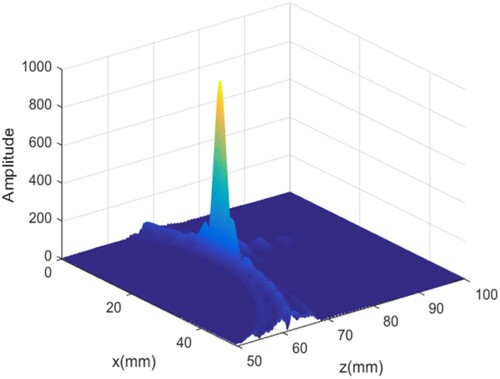
Table 2. Comparison of the measured and actual target positions.
Figure 6. Results of the TR–RTM process of the target in the first layer medium in case 1. (a) The acoustic field distribution for the target signal. (b) and (c) the acoustic field distribution of interface S1 and interface S2, respectively.
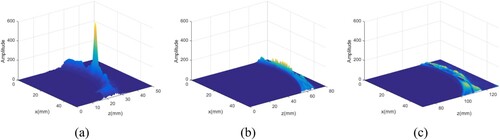
Figure 7. Results of the TR–RTM process of the target in the first layer medium. (a) and (b) the acoustic field distribution of interface and interface
, respectively, and (c) the acoustic field distribution for the target signal.
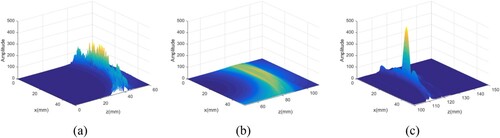
Table 3. Signal-to-interference ratio (SIR) of target signal and interface reflection interference signal.