Figures & data
Figure 1. Prescribed synthetic GST variation-plotted on the left and simulated present transient ground temperature profile plotted on the right.
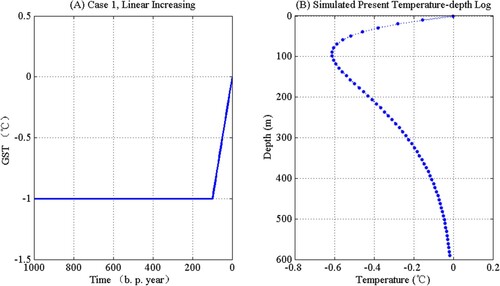
Figure 2. Prescribed synthetic GST variation-plotted on the left and simulated present ground temperature profile plotted on the right.
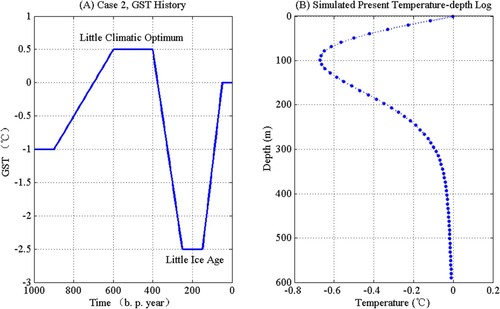
Figure 3. Estimated GST by SVD method and Tikhonov method for the Case 1 with noise level σ = 0.01°C (A) and σ = 0.1°C (B), and Case 2 with noise level σ = 0.01°C (C) and σ = 0.1°C (D). The uncertainties of GSTs are shown by a dark grey band (SVD method) and light grey band (Tikhonov method) around GSTs.
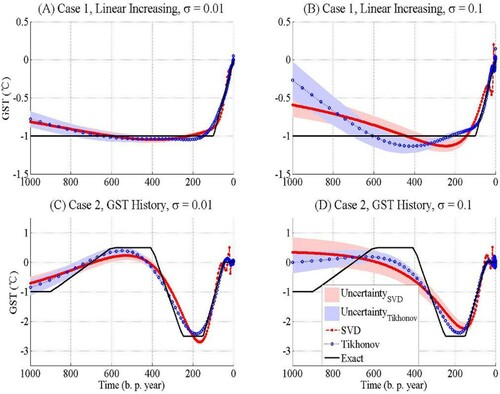
Figure 4. Simulated present (t = 0) borehole temperature using recovered GST and comparison with prescribed present borehole logs.
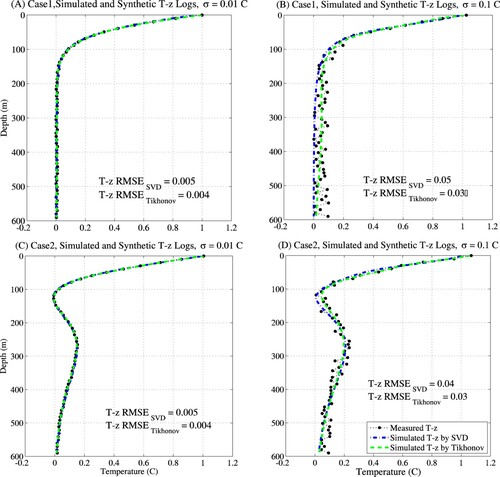
Table 1. RMSEs of GST and induced T-z profiles for synthetic cases by SVD and Tikhonov methods.
Table 2. Regularization parameters for SVD and Tikhonov methods of synthetic cases by L-curve and GCV method.
Figure 5. L-curve for Tikhonov regularization parameter selection of Case 2. The solid line is the L-curve with several value of iterative regularization parameter marked by ‘x’ mark. Corner noted by dashed line is the best selection of regularization parameter which is α = 0.0018.
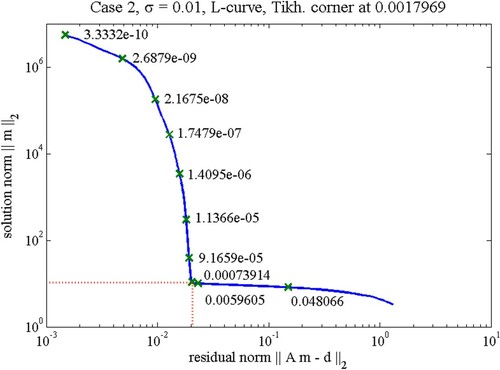
Table 3. Basic data and Permafrost depth.
Figure 6. Temperature-depth profiles of measured temperature on the Wudaoliang borehole (dashed lines). The solid lines represent extrapolations. The shaded area represents anomalous temperature resulting from surface ground temperature variations and its value represented by point marker with dotted line, which start below 12 m.
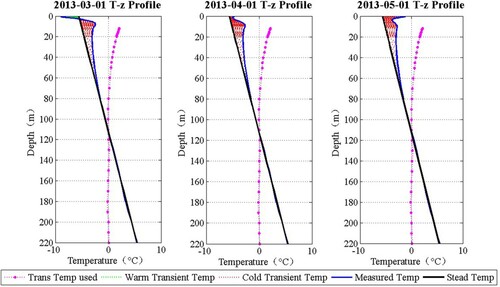
Figure 7. (a) Estimated GSTH for Wudaoliang by SVD method. The uncertainty of GST is shown by a light grey band around GST. (b) Measured and posteriori T-z profiles for the Wudaoliang data, corresponding to the GST histories by SVD method.
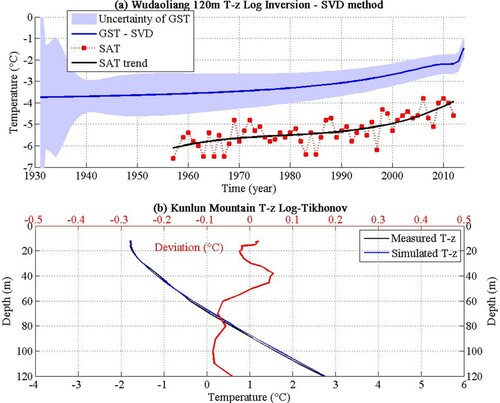
Figure 8. (a) Estimated GSTH for Wudaoliang with the Tikhonov method. The uncertainty of GST is shown by a dark grey band around GST. (b) L-Curve rule for choosing regularization parameter of Tikhonov regularization; (c) Measured and posteriori T-z profiles of Wudaoliang borehole, corresponds to the GST histories by Tikhonov method.
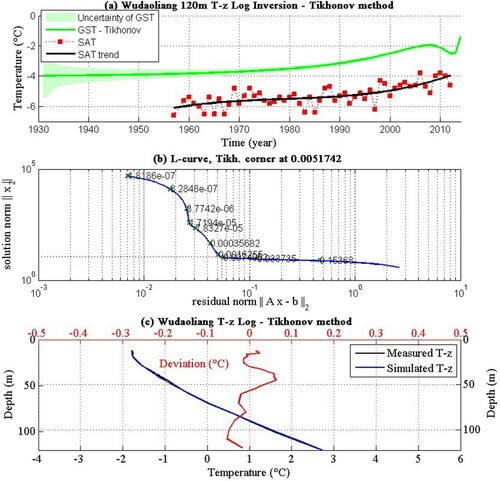
Figure 9. Estimated GSTHs for Wudaoliang by the SVD method and Tikhonov method show the similarities and differences that appear in inversions of the same borehole data by two different methods.
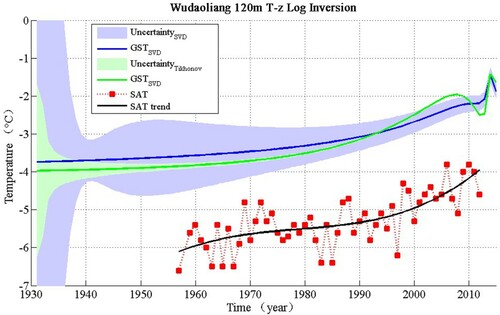
Table 4. Climate change and geothermal gradients parameters from observation boreholes.
Figure 10. Illustration of Δ-function. Here, Δτ is the half of the width of Δ-function, and Δm is the height of Δ-function.
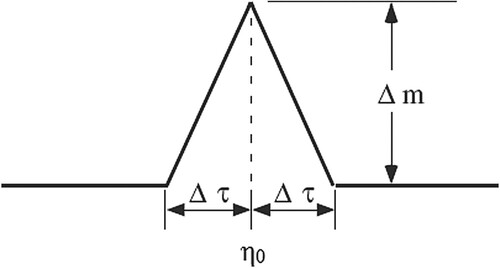
Figure 11. Illustration of resolving function and ‘spread’.
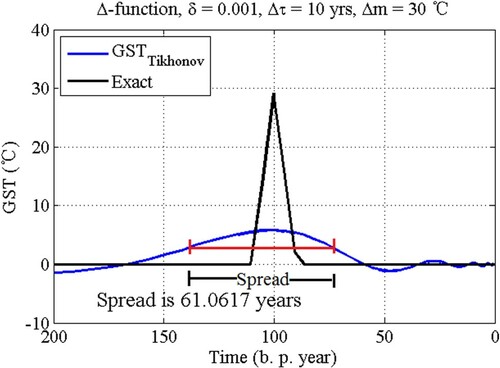
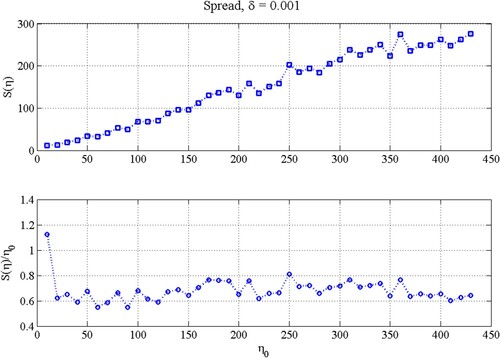
Figure 12. Sensitivity of the spread S(η0) and the fractional spread S(η0)/η0 to the climatic event’s happen time η0.