
Figures & data
Table 1. Descriptive statistics.
Figure 1. Political ideology position of Swiss municipalities over time.
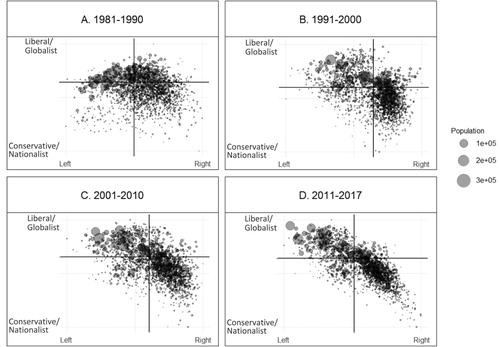
Figure 2. Local Moran’s I statistics for the Left–Right dimension over time.
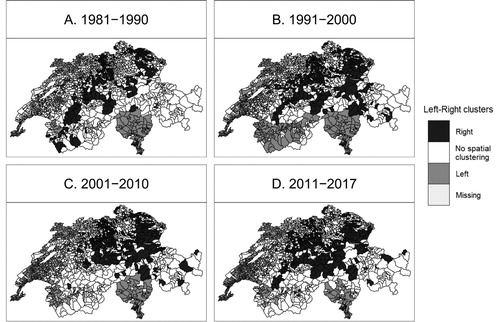
Figure 3. Local Moran’s I statistics for the Conservative/Nationalist–Liberal/Globalist dimension over time.
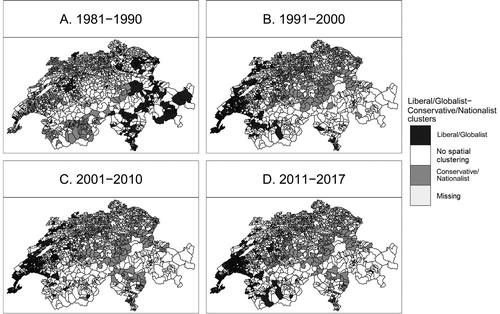
Figure 4. Local Moran’s I statistics for the Ecological–Technocratic dimension over time.
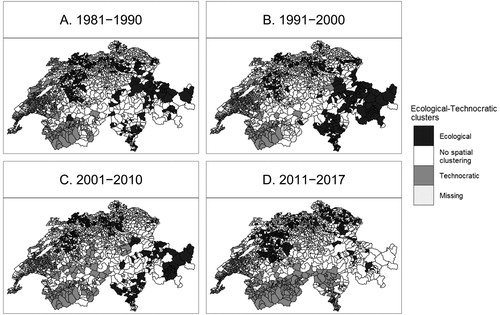
Table 2. Estimate results of the spatial Durbin model on each political ideology dimension.
Table 3. Direct and indirect effects estimates based on the coefficients estimates of the spatial Durbin models reported in .
Supplemental material