Figures & data
Figure 1. Decomposition framework for store sales.
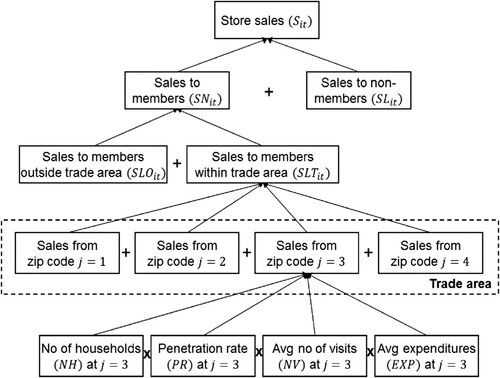
Figure 2. Existing (dots) and new (*) store locations of the retail chain.
Note: Dot sizes reflect store sizes.
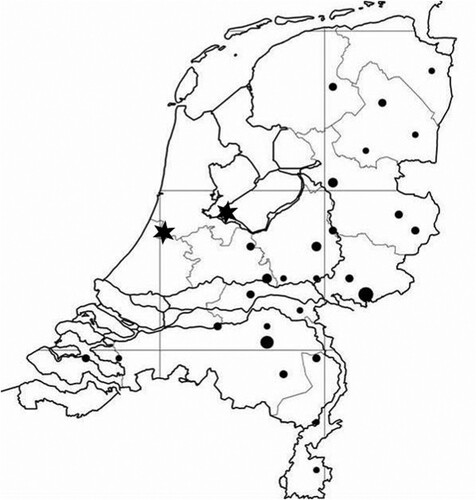
Table 1. Descriptive statistics of the store-level variables.
Table 2. Descriptive statistics of zip code-level variables.
Table 3. Overview of dependent variables and type of model to explain and predict them.
Table 4. Parameter estimates of sales components explained at the store level.
Table 5. Parameter estimates of sales components explained at the zip code level.
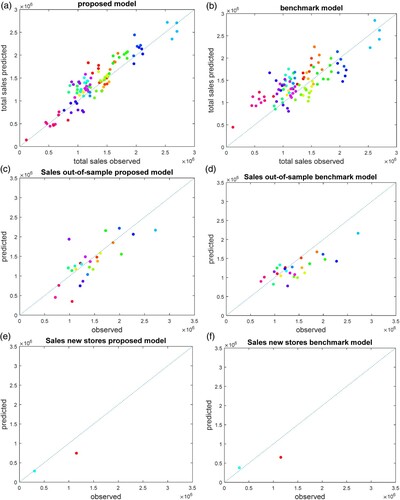
Figure 3. (a) In-sample store sales forecasts using the proposed model, MAPE = 179,870; (b) in-sample store sales forecasts using the benchmark model, MAPE = 272,700; (c) one-year-ahead store sales forecasts using the proposed model, MAPE = 258,330; (d) one-year-ahead store sales forecasts using the benchmark model, MAPE = 272,130; (e) store sales forecasts of new stores using the proposed model, MAPE = 213,200; and (f) store sales forecasts of new stores using the proposed model, MAPE = 287,820.
Note: MAPE, mean absolute prediction error.