
Figures & data
Figure 1. Overall conceptual model.
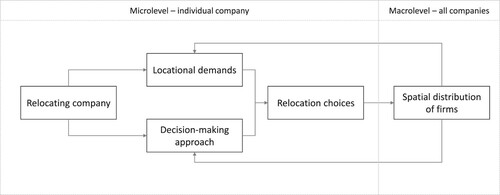
Figure 2. Three-phase decision model.
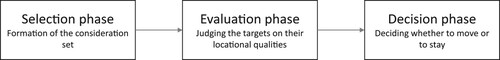
Figure 3. Initial situation of the companies and environment.
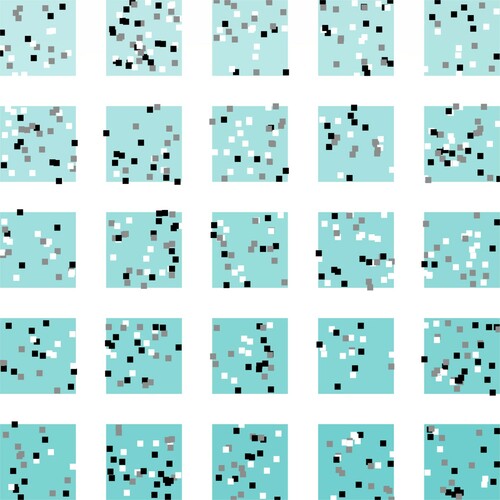
Figure 4. Concentration (Ellison and Glaeser’s ) resulting from increasing the amount of agglomeration in the model.
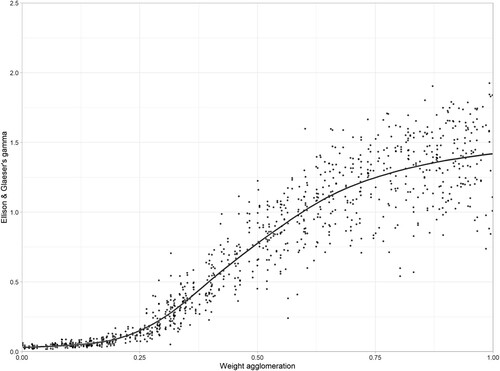
Figure 5. Cell occupation by rank for the three scenarios.
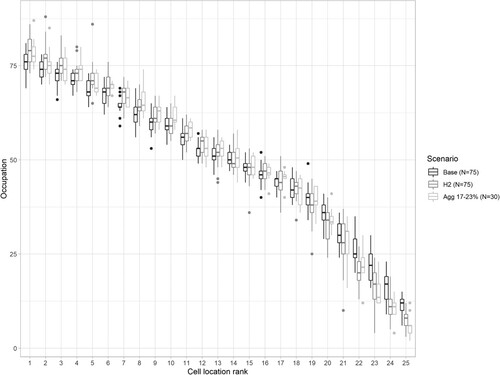
Table 1. Seven scenarios.
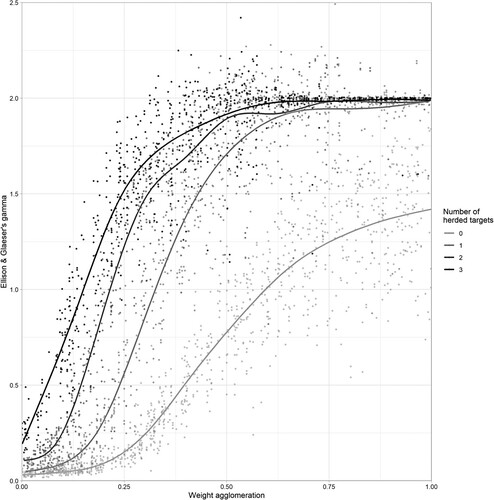
Figure 6. Agglomeration and herding combined (outliers removed).
Supplemental material