
Figures & data
Figure 1. Use steps to perform an injection with the connected self-injection system constituent parts: a disposable 2-step autoinjector for self-injection (AI), a reusable connected monitoring module (ADD-ON) to track device usage, guide patients throughout the injection process, and wirelessly transmit that information to a companion mobile app (APP) installed on a smartphone.
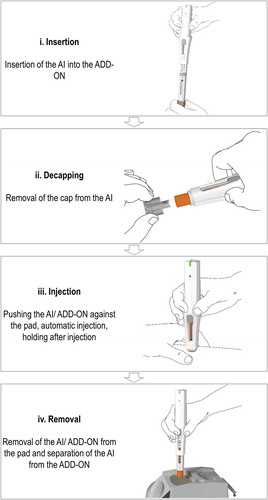
Table 1. Overview of study design. The table illustrates how the study advanced in iterations between eye-tracking studies (ETS1-3) and modifications to the connected self-injection system’s user interface elements (Design Iteration A & B).
Figure 2. Illustration of the single steps of the experiment and the following data analysis. Video analysis of eye tracking data was performed to evaluate product effectiveness and efficiency, and AOI analysis to quantify the product ease of use.
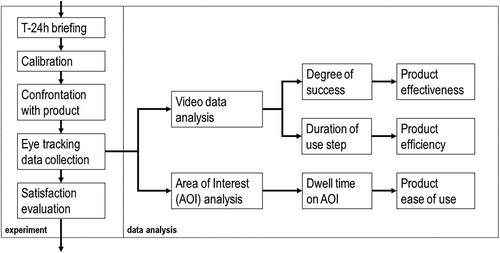
Figure 3. Illustration of the areas of interests (AOIs) for the system constituent parts. AOIs were used as analytical categories to assess if and when participants’ gaze hits a given user interface element.
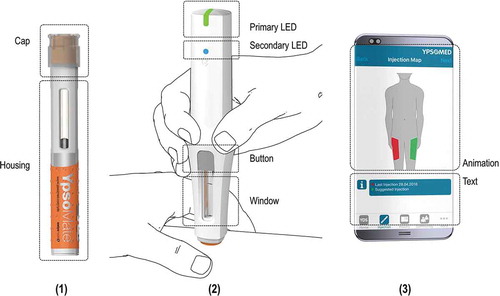
Figure 4. Evolution of product effectiveness over time. Mean and standard deviation (st.dev) of product effectiveness are reported per use step for each eye-tracking study (ETS1-3). Product effectiveness was evaluated by the participants’ degree of success in performing the corresponding task using a four-point rating scale (1–4). The ratings of product effectiveness for each participant (n = 35) are color-coded. The text boxes provide additional information qualitatively explaining the source of unintended user action, interruption of the process, or user hesitation.
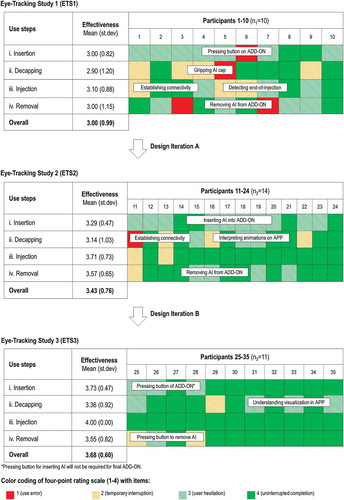
Figure 5. Evolution of product efficiency over time. Mean (standard deviation of) duration [sec] are reported per self-injection use step for each eye-tracking study (ETS1-3). Eye-tracking was used to assess the transition points between use steps in order to accurately assess their duration.
![Figure 5. Evolution of product efficiency over time. Mean (standard deviation of) duration [sec] are reported per self-injection use step for each eye-tracking study (ETS1-3). Eye-tracking was used to assess the transition points between use steps in order to accurately assess their duration.](/cms/asset/2575efce-a962-4340-875a-814d6e837a3e/iedd_a_1563070_f0005_b.gif)
Table 2. Evolution of AOI dwell time over time. Absolute [sec] and relative (%) dwell time per AOI are reported separately for each eye-tracking study (ETS1-3). Decreasing dwell time on AOI corresponds with increasing ease of use. Those AOIs relevant for successful completion of a given use step are color-coded in green.
Figure 6. Evolution of product ease of use over time. Product ease of use is measured by mean dwell time across all areas of interest (AOIs) and use steps. Absolute overall dwell time [sec] and relative dwell time on AOIs relevant for completion of given use step (%) are reported for each eye-tracking study ETS1-3. Decreasing dwell time on AOI relates with increasing ease of use.
![Figure 6. Evolution of product ease of use over time. Product ease of use is measured by mean dwell time across all areas of interest (AOIs) and use steps. Absolute overall dwell time [sec] and relative dwell time on AOIs relevant for completion of given use step (%) are reported for each eye-tracking study ETS1-3. Decreasing dwell time on AOI relates with increasing ease of use.](/cms/asset/f062ec73-fc37-474c-ae6f-b72a16f0bdd9/iedd_a_1563070_f0006_b.gif)