Figures & data
Figure 1. Study design. (a) Bioequivalence. (b) Real-life human factors study. AE, adverse event; AI, autoinjector; CG, caregiver; gen, generation; HAQ-DI, Health Assessment Questionnaire–Disability Index; HCP, health care professional; HF, human factors; ISR, injection site reaction; PFS, prefilled syringe; SC, subcutaneous; SJC, swollen joint count; TJC, tender joint count. a,bTocilizumab 162 mg/0.9 mL SC using AI or PFS.
Figure 2. Leak back in the real-life human factors study. (a) Assessment.a (b) Outcomes.b HCP, health care professional. aNot to scale. bSelf-injecting patients: visit 1, n = 18; visit 2, n = 17; visit 3, n = 18. Caregiver-injected patients: visit 1, n = 17; visit 2, n = 17; visit 3, n = 16. HCP-injected patients: visit 1, n = 19; visit 2, n = 17; visit 3, n = 18.
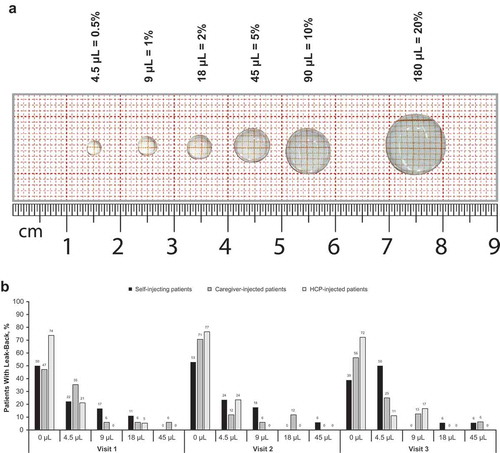
Table 1. Baseline demographics of participants enrolled in the bioequivalence and real-life human factors studies.
Table 2. Summary statistics of tocilizumab serum PK parameters by administration device.
Table 3. Statistical analysis of tocilizumab bioequivalence by administration device.
Table 4. Tocilizumab bioequivalence by administration site.
Figure 3. Analysis of tocilizumab pharmacokinetic parameters by administration device in the bioequivalence study. (a) Mean serum concentration–time profiles. (b) Bioequivalence. AI, autoinjector; AUCinf, area under the serum concentration–time curve from time 0 to infinity; AUClast, area under the serum concentration–time curve from time 0 to the time of the last measurable concentration; CI, confidence interval; Cmax, maximum concentration; PFS, prefilled syringe; SD, standard deviation; TCZ, tocilizumab. Analyses were performed on log-transformed parameters with treatment, period, sequence, and subject nested within sequence as fixed effects. Dashed vertical lines represent the predefined bioequivalence range.
Table 5. Safety in the bioequivalence and real-life human factors studies.
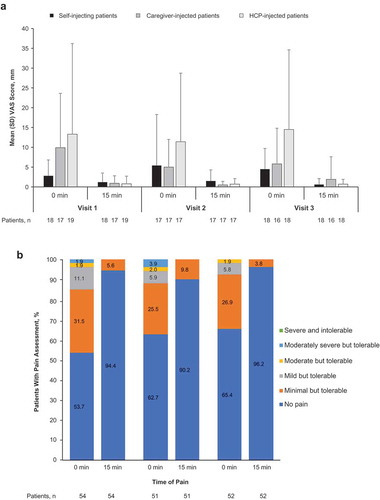
Figure 4. Summary of patient assessment of injection pain. (a) 100-mm VAS score by injection group and (b) categorical pain scores in all patients at 0 and 15 minutes after injection in the real-life human factors study. HCP, health care professional; SD, standard deviation; VAS, visual analog scale.