Figures & data
Table 1. Injection volume and duration of recently USA FDA-approved drugs using handheld autoinjectors for subcutaneous drug delivery.
Table 2. Selected marketed and late-stage development biologics self-administered using 2.25 mL pre-filled syringe (PFS) or handheld 2.25 mL autoinjector (AI). Status by 6 December 2019*.
Table 3. User population and disease states in the simulated use study.
Figure 1. Procedure of non-interventional simulated use study based on single-site visit.
Figure 2. Experimental setup for user’s force data collection. Expanded view diagram of sensor-augmented foam cushion to capture user’s force-time data. (a) Three force sensors were placed between the foam cushion and strap to attach the foam cushion on the patients’ or mannequin’s abdomen. Example of patient performing a simulated injection with the sensor-augmented foam cushion attached to abdomen (b) .
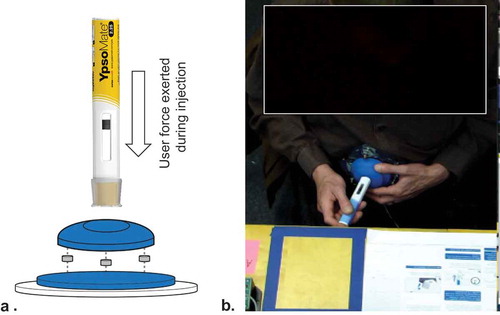
Figure 3. Typical user’s force-time curve. The injection duration is the time between injection start tstart and injection end tend. Fmin and Fmax are the minimum and maximum user’s force applied when holding the device against the skin during injection, respectively. Fmean is the mean force exerted during injection to hold the device against the skin. Fdev is the user’s force threshold specified by the handheld autoinjector required to complete the injection.
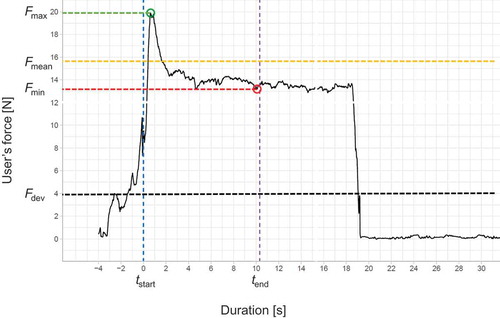
Table 4. Minimum (Fmin), mean (Fmean), and maximum (Fmax) user’s force per group for successfully completed injections.
Figure 4. Average effects of injection duration on user’s force. The red line shows the estimated linear relation (pooled OLS) between injection duration and minimum user’s force Fmin (OLS.1), mean user’s force Fmean (OLS.2), and maximum user’s force Fmax (OLS.3) on a logarithmic scale.
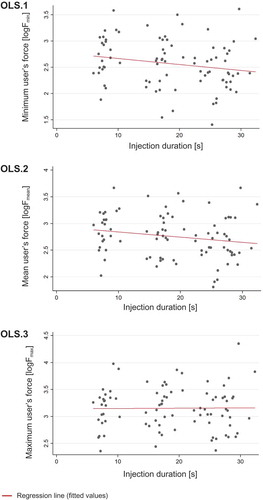
Table 5. Summary statistics for linear regression models (pooled OLS) considering minimum injection force Fmin (OLS.1), mean injection force Fmean (OLS.2), and maximum injection force Fmax (OLS.3) as response variables.
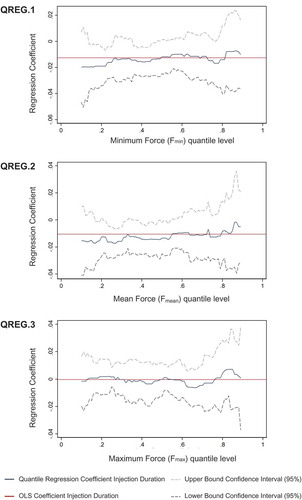
Figure 5. Quantile-specific effects of injection duration on user’s force. The graphs show the estimated quantile regression coefficients of injection duration along the vertical axis across the distribution of minimum user’s force Fmin (QREG.1), mean user’s force Fmean (QREG.2), and maximum user’s force Fmax (QREG.3) along the horizontal axis. The two dashed lines show the upper and lower bounds of the 95% confidence interval for the quantile regression coefficients shown as blue lines. The red horizontal line shows the linear regression estimates (pooled OLS) of the mean effect of injection duration on the user’s force variables.