
Figures & data
Figure 1. The three presentations of the pen device (blue: 6 mg; red: 12 mg; yellow: 20 mg).
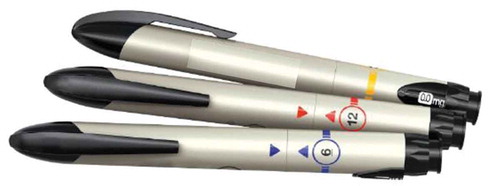
Table 1. Use scenarios and knowledge tasks.
Table 2. Participant demographics.
Figure 2. Analysis of overall use errors (related to critical task) with potential for harm.
GHD: Growth hormone deficiency.
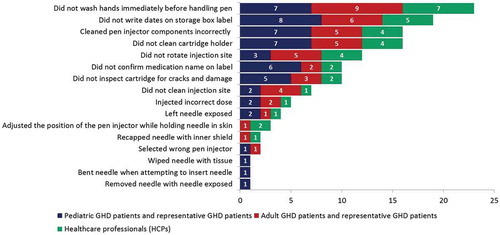
Figure 3. Total number of use errors on critical tasks per user group.
GHD: Growth hormone deficiency.
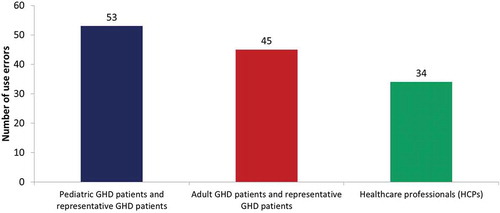
Figure 4. Number of observed errors with potential for harm in scenario 1 and scenario 3.
IFU: Instructions for use.
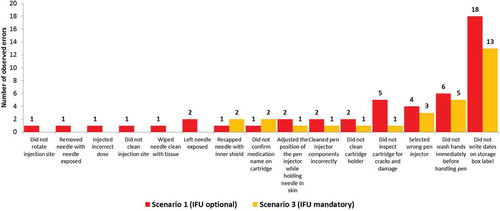
Table 3. Analysis of the use errors, root causes and action taken.