Figures & data
Table 1. Approved drugs in autoinjection devices: indication, manufacturer, volumes, and injection times.
Figure 1. (a) PFS needle dimensions- overall length 14.4 mm, exposed length 8 mm, target extension length/tissue insertion depth 6.0 mm. (b) Microscopic images (95X) of 29 G TW, 27 G STW, and 27 G UTW PFS cannula. G = gauge; PFS = prefilled syringe; TW = thin wall; STW = special thin wall; UTW = ultra-thin wall.
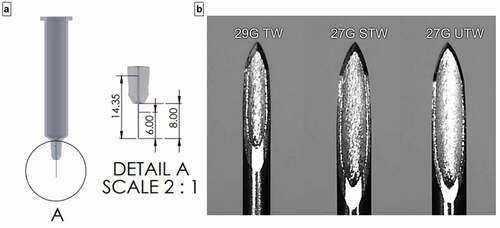
Table 2. Delivery time (seconds) into air and in vivo swine tissue (mean ± SD; n value) for LVAI devices and placebo combinations at varying PFS internal cannula dimension, formulation viscosity, and LVAI spring force.
Figure 2. Delivery time as a function of LVAI device PFS/Spring Force combination and viscosity for both (a) injection in air, n = 5–8 per configuration and (b) in vivo injection, n = 10–17 per configuration. Within each PFS/Spring Force, delivery time increased with increasing viscosity. Dotted red line represents nominal 15-second injection duration. (c) Differences in mean injection times (?T) between in vivo and air delivery for paired configurations (?T = MeanTinvivo- MeanTair). G = gauge; PFS = prefilled syringe; SFLOW = Low Spring Force; SFHIGH = High Spring Force; TW = thin wall; STW = special thin wall; UTW = ultra-thin wall. In air delivery times were extracted from gravimetric weight vs time curves. To allow direct comparison, presented in vivo delivery times do not include the additional standardized 3 second hold time post-injection completion.
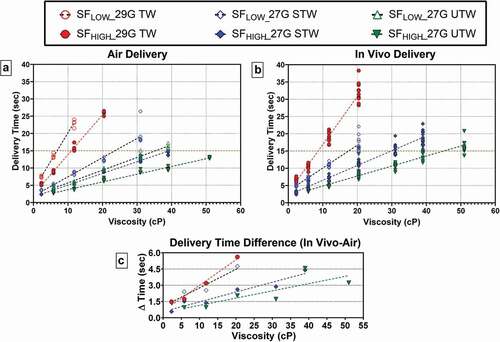
Figure 3. % Delivery volume for (a) injection in air, and (b) in vivo as a function of the nominal 2.0-mL target fill volume. G = gauge; SFLOW = Low Spring Force; SFHIGH = High Spring Force; TW = thin wall; STW = special thin wall; UTW = ultra-thin wall.
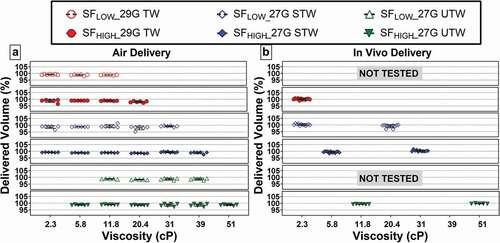
Figure 4. (a) Representative fluoroscopic images of 2-mL depositions in tissue at all tested solution viscosities. Under fluoroscopy the skin appears as light gray contrast with the air above (white) and the slightly darker gray subcutaneous tissue boundary below. All contrast media injection depots (black) appear as dark oblate spheroids within the SC space with observable top and bottom margins. The interface between the dermal and subcutaneous space is also evident in the images, typically found less than 3 mm from the surface of the skin. A radiopaque scale used for distance measurement calibration is shown in top-middle panel. (b) Scatter plot of individual depth measurements from the surface of the skin to the top and bottom of deposition by PFS and viscosity. Areas enclosed by colored boxes represent top of depot measurements. Arrow indicates device in which ID injectate was observed. Pink line represents pre-injection dermal thickness measurements (2.4 ± 0.19 mm; Mean ± SD) pooled across all injections. G = gauge; SFLOW = Low Spring Force; SFHIGH = High Spring Force; PFS = pre-filled syringe; TW = thin wall; STW = special thin wall; UTW = ultra-thin wall.
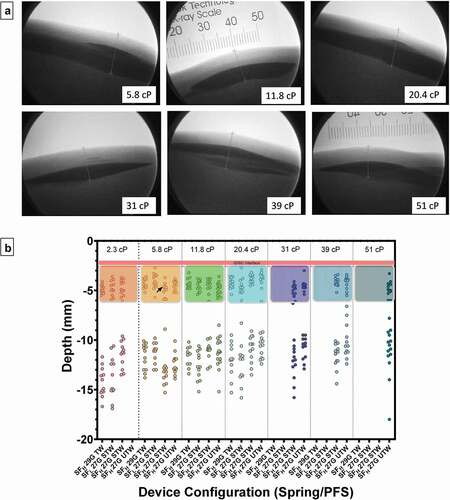
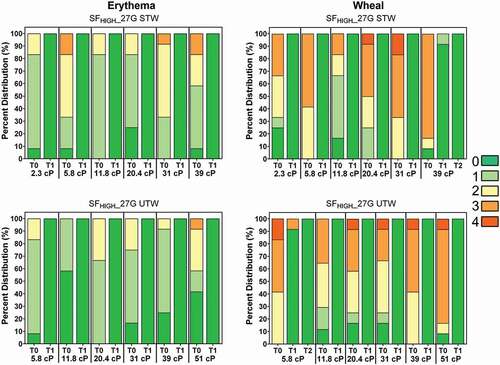
Figure 5. Observed erythema (left) and wheal (right) scores (0–4) by viscosity over time expressed as a percentage of total injections for LVAI SFHIGH 27 G STW (top) and UTW (bottom) device configurations immediately after injection (T0) and through resolution. Regardless of injection test condition, all erythema resolved to non-detectable levels (Score = 0; dark green) by T-60 minutes (T1) post-injection; all wheal scores resolved within 2 hours (T2) post injection. Erythema and wheal scores for other injection conditions are included in Supplemental Figure S3. G = gauge; SFLOW = Low Spring Force; SFHIGH = High Spring Force; TW = thin wall; STW = special thin wall; UTW = ultra-thin wall.