Figures & data
Figure 1. Model diagram of nanomedicines- penetrated across the blood brain barrier for treating brain diseases. BBB: blood-brain barrier; IGFR: insulin-like growth factors receptor; INR: insulin receptor; LRP: lipoprotein receptor-related protein; MSN: mesoporous silica nano-particles; NPs: nanoparticles; PLGA: lactic-co-glycolic acid; QDs: quantum dots.
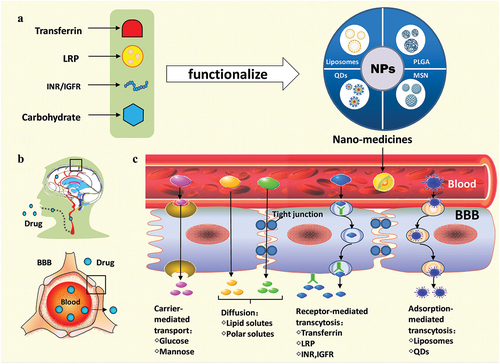
Table 1. Liposome NPs-based drug delivery practice.
Table 2. PLGA NPs based drug delivery practice.
Table 3. Delivery strategies nd beneficial effects of different kinds of NPs in the models of in vitro and in vivo.
Figure 2. Different ISF drainage routes in normal rats and demyelinated rats. Briefly, in healthy rats, the obstruction of the myelinated fiber tracts is compact, and ISF from the caudate nucleus (Cn) could not drain to the ECS of the thalamus (Tha) and vice versa. However, in the demyelinated rats, myelinated fiber tracts are loose, which makes ISF from the caudate nucleus drain to the thalamus and a small quantity of ISF from the thalamus drain to the caudate nucleus [Citation97].
![Figure 2. Different ISF drainage routes in normal rats and demyelinated rats. Briefly, in healthy rats, the obstruction of the myelinated fiber tracts is compact, and ISF from the caudate nucleus (Cn) could not drain to the ECS of the thalamus (Tha) and vice versa. However, in the demyelinated rats, myelinated fiber tracts are loose, which makes ISF from the caudate nucleus drain to the thalamus and a small quantity of ISF from the thalamus drain to the caudate nucleus [Citation97].](/cms/asset/17749842-8ed7-43b0-a952-d0f2b163556e/iedd_a_2139369_f0002_oc.jpg)
Figure 3. Unevenness distribution of drug in the brains of 11C-befloxatone. (a), 11C-verapamil (b), and 125I-HIRMAb-IDUA (c) imaged by the positron emission tomography and nano-packaged siRNA (d) scanned by the fluorescent imaging of the small animals, respectively. Figures were adapted from reference [Citation102–105].
![Figure 3. Unevenness distribution of drug in the brains of 11C-befloxatone. (a), 11C-verapamil (b), and 125I-HIRMAb-IDUA (c) imaged by the positron emission tomography and nano-packaged siRNA (d) scanned by the fluorescent imaging of the small animals, respectively. Figures were adapted from reference [Citation102–105].](/cms/asset/7971b3d8-5381-4337-9c14-ba6e7f1998e4/iedd_a_2139369_f0003_oc.jpg)
Figure 4. Brain extracellular space and drug delivery. a. Brain ECS and ISF in the cortex and other cerebral parenchyma. BBB: blood-brain barrier; PA: Pial artery; PPS: Pial perivascular space. b, c. Drugs penetrate out of the capillaries and enter brain ECS. d. Brain ECS systems account for 15–20% of the total brain mass. ECS: extracellular space; ISF: interstitial fluid; N: neuronal cells; V: vessel. e-h. Brain ECS division system in the brains detected by MRI with Gd-DTPA probe. Am: amygdala; CPu: caudate putamen; Mb: midbrain; MRI: magnetic resonance imaging; mPC: medial prefrontal cortex; OB: olfactory bulb; OC: occipital cortex; SC: superior colliculus; T: thalamus. Figure was adapted from reference [Citation97].
![Figure 4. Brain extracellular space and drug delivery. a. Brain ECS and ISF in the cortex and other cerebral parenchyma. BBB: blood-brain barrier; PA: Pial artery; PPS: Pial perivascular space. b, c. Drugs penetrate out of the capillaries and enter brain ECS. d. Brain ECS systems account for 15–20% of the total brain mass. ECS: extracellular space; ISF: interstitial fluid; N: neuronal cells; V: vessel. e-h. Brain ECS division system in the brains detected by MRI with Gd-DTPA probe. Am: amygdala; CPu: caudate putamen; Mb: midbrain; MRI: magnetic resonance imaging; mPC: medial prefrontal cortex; OB: olfactory bulb; OC: occipital cortex; SC: superior colliculus; T: thalamus. Figure was adapted from reference [Citation97].](/cms/asset/489bad7f-5992-45b5-b47c-4c20d051f729/iedd_a_2139369_f0004_oc.jpg)
Figure 5. Changes in brain ECS and ISF drainage in Alzheimer’s disease, Parkinson’s disease, brain tumor, and multiple sclerosis. (a) A smooth flow of ISF in brain ECS of control mice. (b) A larger tortuosity of ECS in AD model mice. (c) Drug delivery failure in the Aβ-deposited ECS in AD model. d. An increase in α and λ values in Lewy body (LB)-induced PD model mice. This figure was edited from Reference [Citation136]. e. Structure of ECS and ISF flow in ECS among neurons. ECM: extracellular matrix. f-h. Changes in ECS volume fraction in normal brain (f), cytotoxic edema (g), and brain tumor/vasogenic edema (h). Cell: black; nucleus: green; extracellular matrix (ECM): yellow. These figures were edited from Reference [Citation141]. i, j. Alteration of ECS volume and ISF drainage in a demyelinated rat model. This figure was adopted from Reference [Citation98].
![Figure 5. Changes in brain ECS and ISF drainage in Alzheimer’s disease, Parkinson’s disease, brain tumor, and multiple sclerosis. (a) A smooth flow of ISF in brain ECS of control mice. (b) A larger tortuosity of ECS in AD model mice. (c) Drug delivery failure in the Aβ-deposited ECS in AD model. d. An increase in α and λ values in Lewy body (LB)-induced PD model mice. This figure was edited from Reference [Citation136]. e. Structure of ECS and ISF flow in ECS among neurons. ECM: extracellular matrix. f-h. Changes in ECS volume fraction in normal brain (f), cytotoxic edema (g), and brain tumor/vasogenic edema (h). Cell: black; nucleus: green; extracellular matrix (ECM): yellow. These figures were edited from Reference [Citation141]. i, j. Alteration of ECS volume and ISF drainage in a demyelinated rat model. This figure was adopted from Reference [Citation98].](/cms/asset/ef7a9fb1-b7bf-401f-9400-3d67958c021f/iedd_a_2139369_f0005_oc.jpg)
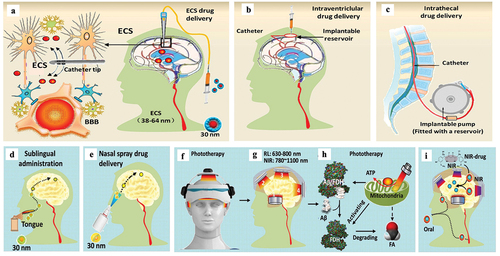
Figure 6. Multiple patterns of invasive and noninvasive administration for treating brain diseases. a. Brain ECS administration. b. Intraventriclular drug delivery. c. Intrathecal administration. D-E. Noninvasive drug delivery for treating brain diseases, including: sublingual administration (d) and Nasal spray (e). f, g. Phototherapy with red light (RL) at 630 ~ 680 nm or Near-infrared light (NIR) at 780 ~ 1100 nm. h. Mechanisms of phototherapy to reduce Aβ toxicity. i. Near-infrared light (NIR)-activated photosensitive drug release.