
Figures & data
Table 1. Formulations concerning raw materials and physical mixtures.
Table 2. Printability parameters concerning different adjustments on temperature ranges, pressure, and speed during 3DP of scaffolds. Shape fidelity (%) compared to actual size dimensions is noted.
Figure 1. Acquired temperature zones (T1, T2, T3, and T4) of the printhead, during different temperature system adjustments, depicting (a) TR1 and (b) TR2.
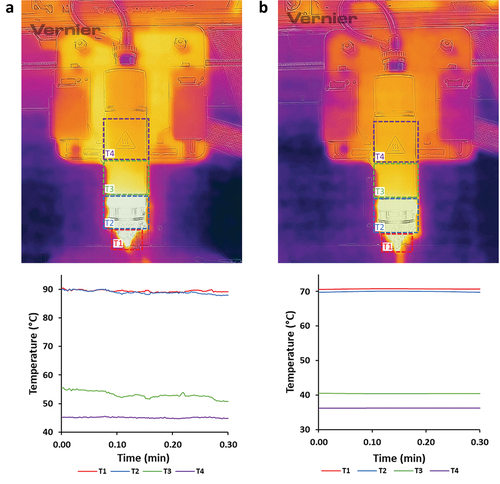
Table 3. Temperature ranges of the printhead, during printability studies.
Figure 2. Optical microscope images illustrating (i) the raster width and gap dimensions and SEM-EDS microscope analysis depicting (ii) the surface and (iii) the elemental map of (a) SS1, (b) SS2, (c) SS3 and (d) SS4 3D extruded samples, respectively.
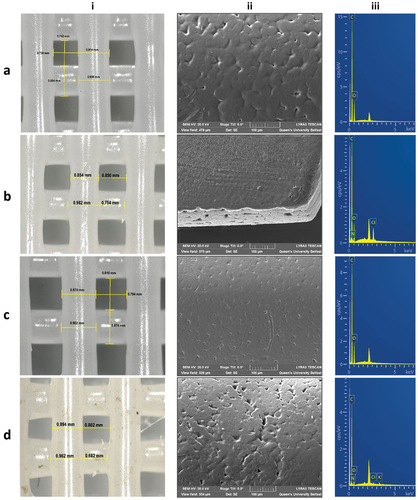
Figure 3. TGA thermograms of (a) PCL, CS, PRC, PM2, and PM4, and (b) all SSs and PMs. (c) STDSC thermograms of PCL, PRC, and CS, and (d) MTDSC thermograms of all SSs (first heat cycle) and PRC (second heat cycle).
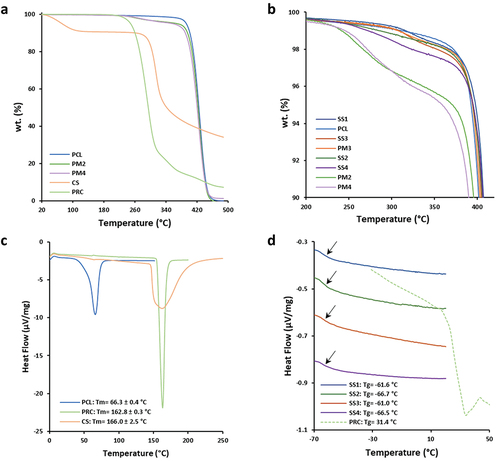
Figure 4. (a) Stress-strain curves and (b) bar chart of Young’s modulus (E), ultimate tensile strength (UTS), and maximum elongation (ME) values of SS1, SS2, SS3, and SS4 3D printed scaffold samples, respectively (n = 5).
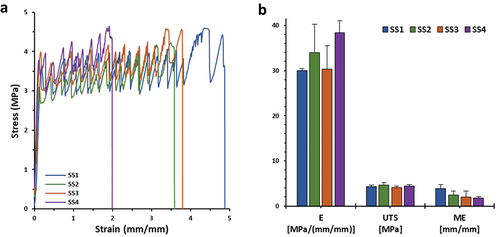
Table 4. Evaluation of E, UTS, and ME mechanical parameters of SS1, SS2, SS3, and SS4 3D printed scaffold samples (n = 5).
Figure 5. In vitro % release of procaine hydrochloride (PRC HCl) vs. time (SS2 and SS4 extruded scaffolds) at PBS medium (t= 0–168 h). The results denote the mean value (n= 4, SEM < 2) and are normalised to the %wt. Of the loaded amount of the API.
Table 5. Drug release kinetics of procaine from the 3D printed extruded scaffolds, following the Ritger-Peppas mathematical modeling approach.